Monitoring with Elastic APM .NET for the Entity Framework with MariaDB - Part 2
In this article, I will add a MariaDB database and send the metrics to APM. I use for the connection from .NET to MariaDB the Entity Framework (EF) Core. Also, I show how you can start MariaDB with docker-compose. The source code you can find on Github.
Start MariaDB with docker-compose
I added the Docker image and the volumes to my previous docker-compose file with Elasticsearch and Kibana.
mariadb:
  image: mariadb:10.5.9
  ports:
    - 3306:3306
  environment:
    MYSQL_ROOT_PASSWORD: 'root_pw'
  volumes:
    - mariadb_data:/var/lib/mysql
    - mariadb_conf:/etc/mysql

volumes:
  esdata:
    driver: local
  mariadb_data:
    driver: local
  mariadb_conf:
    driver: local
Now you can start the docker-compose with docker-compose up -d. If everything works should MariaDB started. You can check it if you connect to the MariaDB with a client like HeidiSQL, DBeaver, Rider or the other 1000 tools.
Configure database with EF Core for my project
I added the database context in a separate project DatabaseRepository and not in the RestService. Add the NuGet package Microsoft.EntityFrameworkCore.Design to your start project RestService. To initialize the database from code you can run the following command from the database project folder DatabaseRepository.
dotnet tool install --global dotnet-ef
dotnet add package Microsoft.EntityFrameworkCore.Design
dotnet ef --startup-project ../RestService/ migrations add InitialCreate
dotnet ef --startup-project ../RestService/ database update
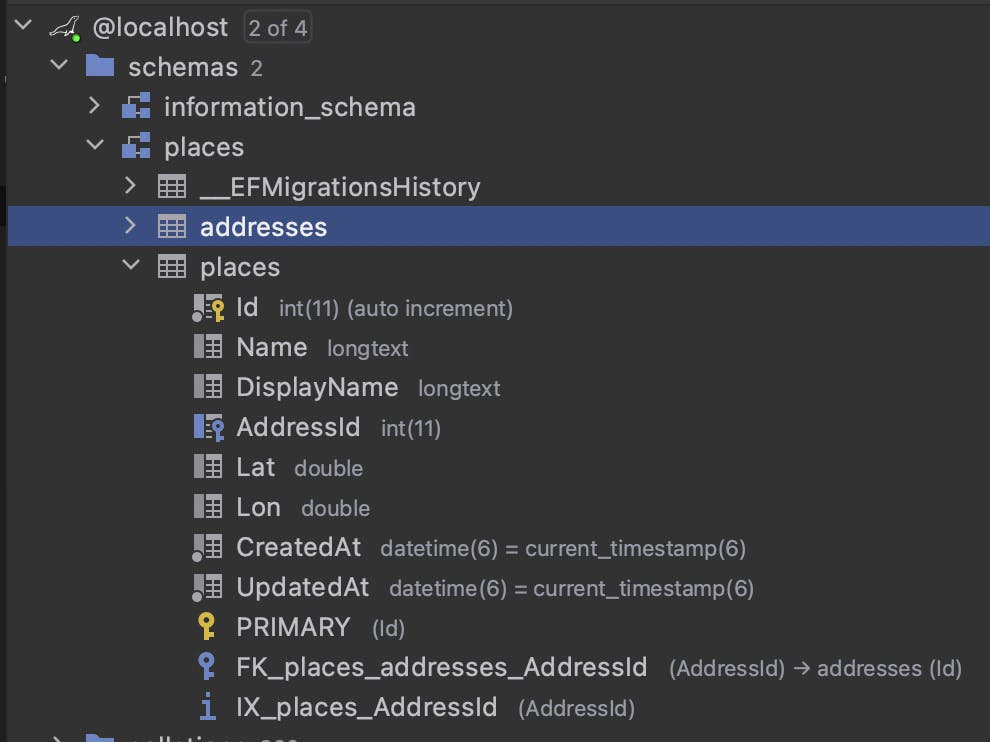
After the last command, the database should be created. Here is the result of my project.

Configure .NET APM
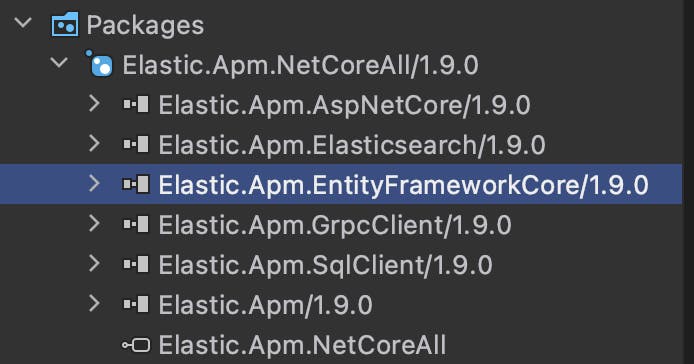
In the first article, I added the NuGet package Elastic.Apm.NetCoreAll. In the package is also the EntityFramework. This means that automatically all EF requests are logged to APM.

Results in Kibana APM
When we start the RestService and send some requests to it, the MySQL requests should also be logged. In Kibana APM you should see now two dependencies.

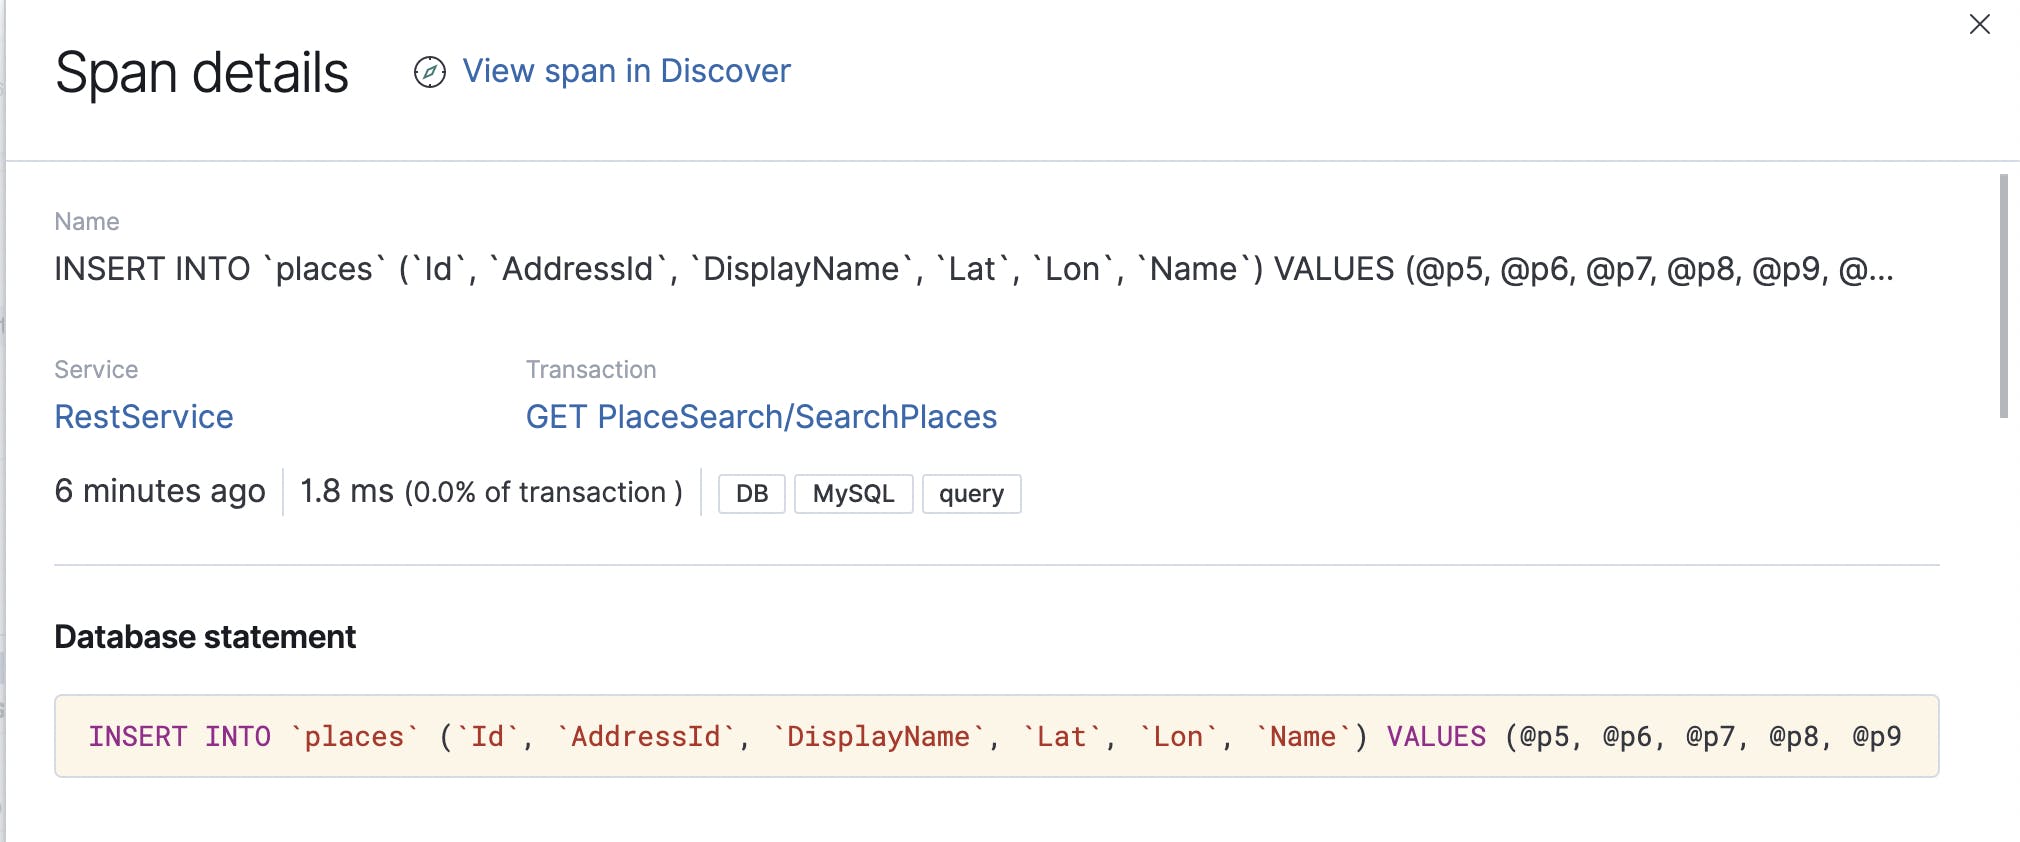
If you go to a transaction → Trace sample and click on a SQL query, you can see the full details of the SQL query. This is very helpful to see long-running SQL queries.

You can also see unhandled exceptions in APM. You can also create Kibana alerts for these errors and they can notify you when an error occurs. But the Kibana Alerting is very limited in the free version. Maybe I can try Opendistro there.

In the details of the error, you can see the exception described in detail and when it occurs.

Conclusion
In this article, I described how you can start MariaDB with docker-compose, configure EF Core and how the results in the Kibana APM look. In the next article, I will look into the Elasticsearch APM queries
