Monitoring with Elastic APM .NET for Elasticsearch - Part 3
In this article, I add an Elasticsearch to my test project and then the APM should automatically monitor also my Elasticsearch queries. My test project you can find on my Github.
Configure Elasticsearch and APM in .NET
I described how to start Elasticsearch with Docker in my first article in this series. I use the high-level client library NEST of Elasticsearch in my .NET applications. Install it to your project using Install-Package NEST. Now you can write the access to the Elasticsearch. In my project, you can find a very simple solution.
In the first article, I added the NuGet package Elastic.Apm.NetCoreAll. In the package is also the Elasticsearch included. This means that automatically all Elasticsearch requests are logged to APM.
Now when you start the application and sent some requests to the REST service https://localhost:5001/places/searchPlacesElasticsearch?query=bar%20dresden&limit=10, all Elasticsearch requests and responses should be automatically logged to the APM server.
Elasticsearch APM metrics in Kibana
You can go to the Kibana APM and see the final results. You can see the next dependency Elasticsearch in the dependencies.

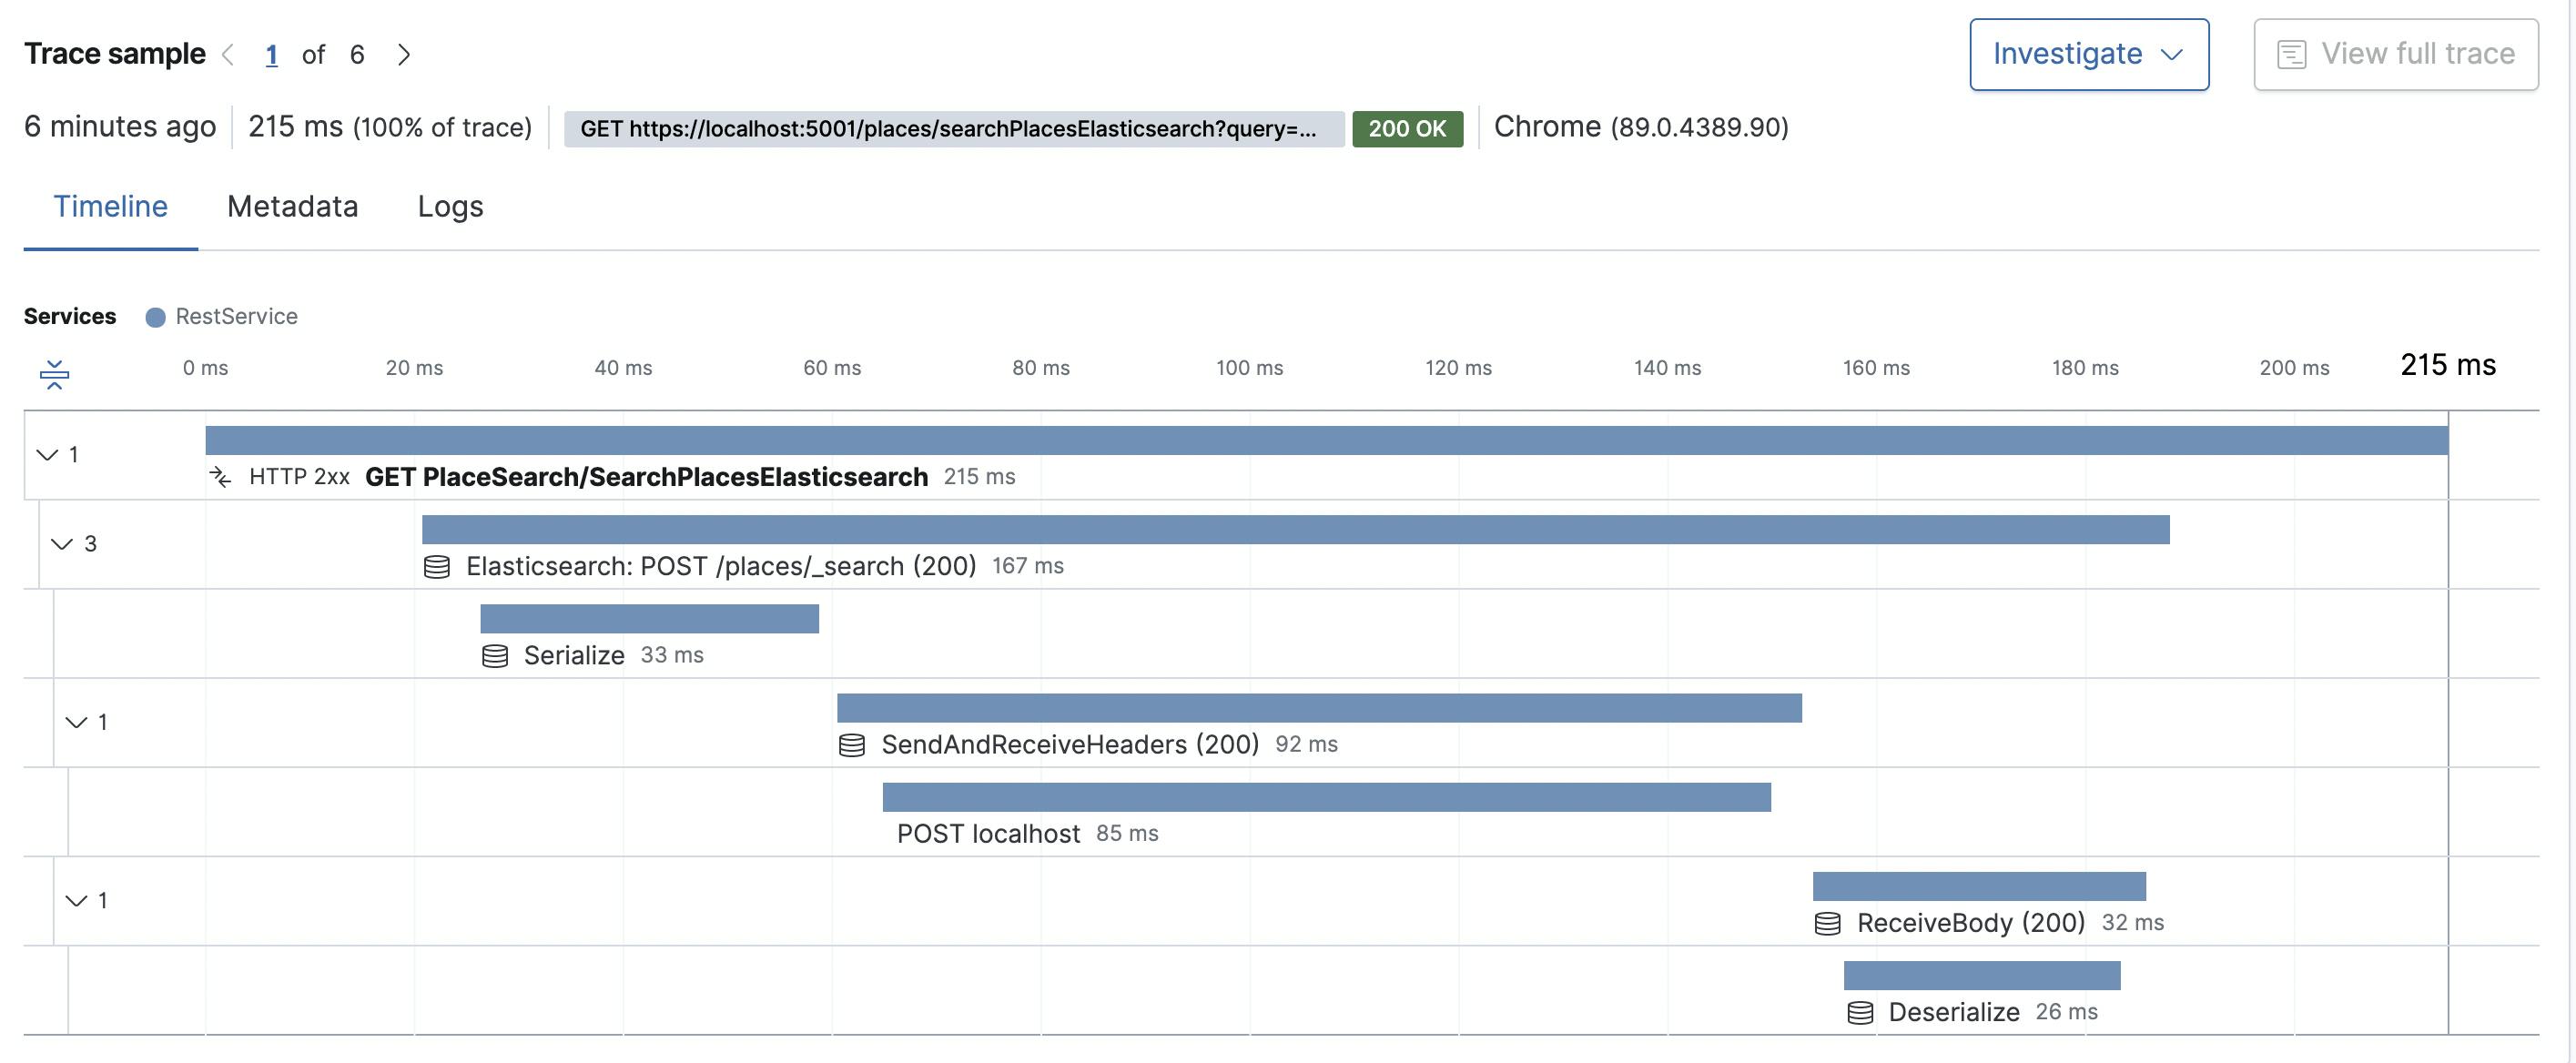
In the transaction, you can now see the Elasticsearch queries.

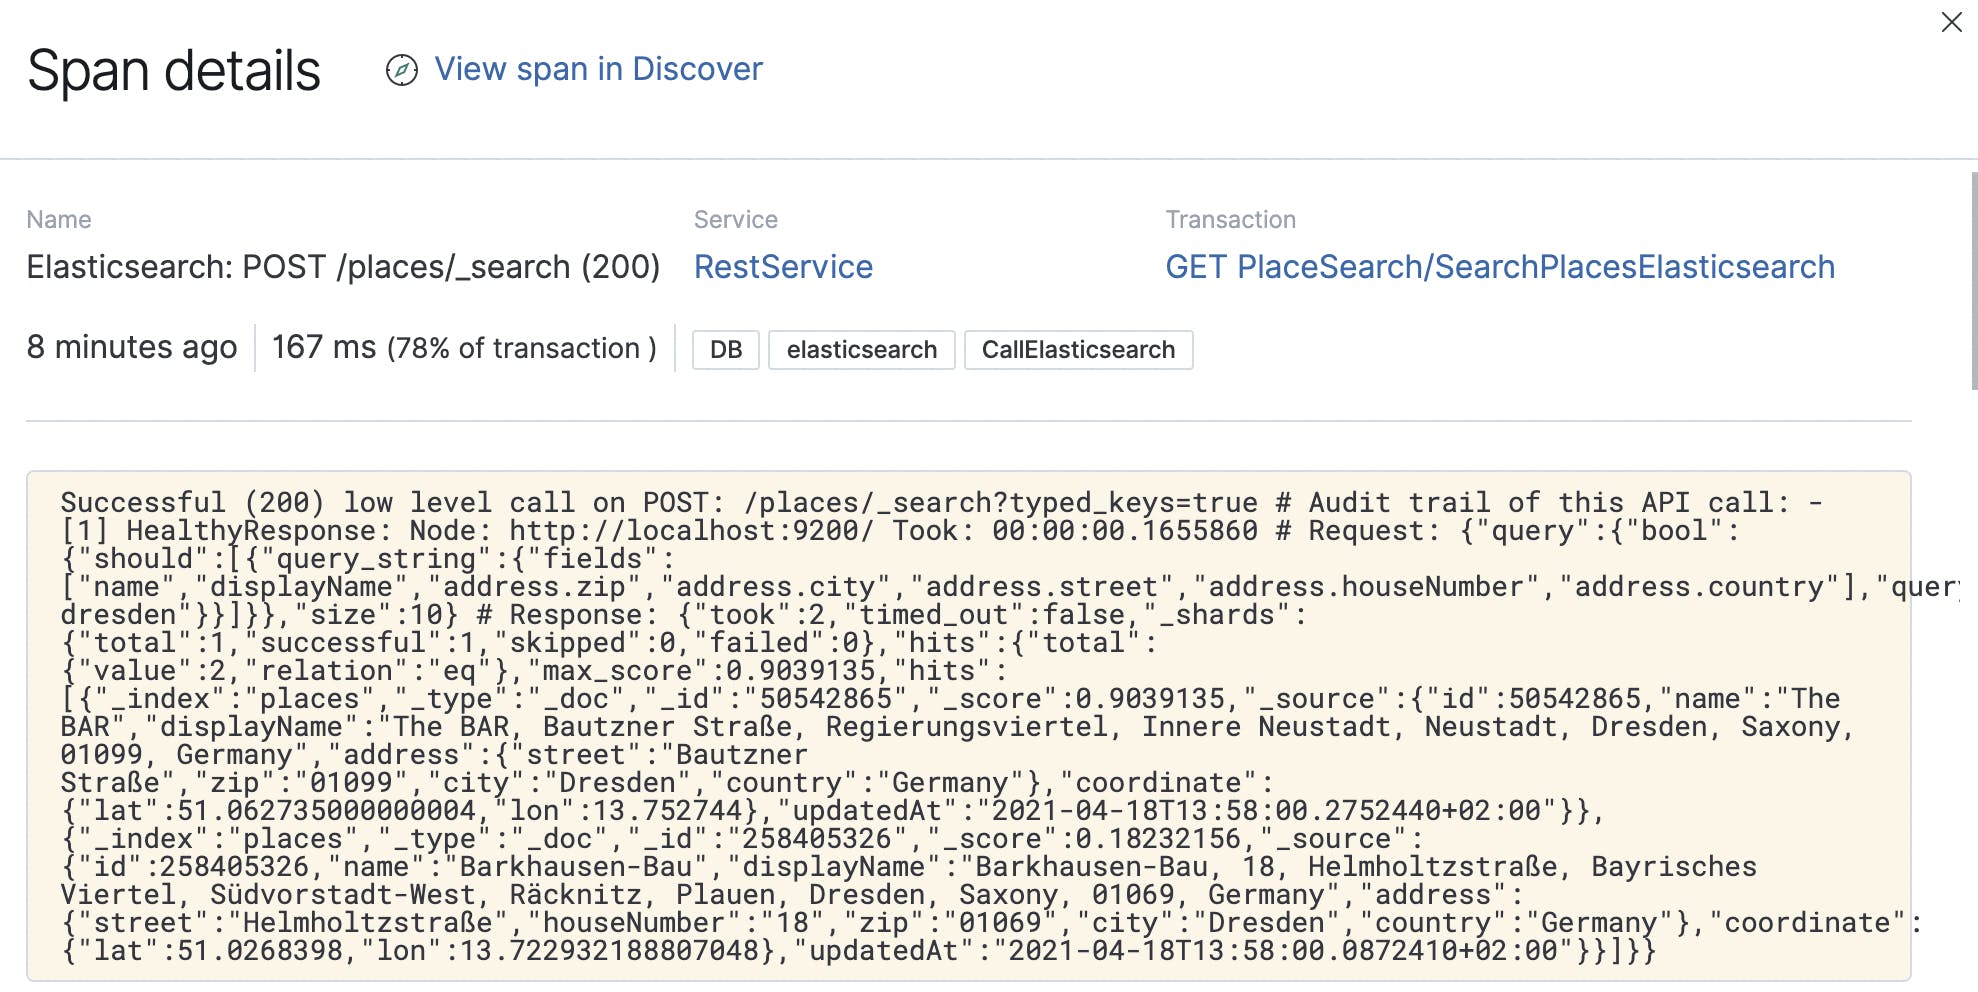
Now if you click on the Elasticsearch query, you can see more details like the query and the response.

The Elasticsearch request and response are seen only because I have enabled the DisableDirectStreaming() option in NEST. In production, it is better to disable the option.
ConnectionSettings settings = new ConnectionSettings(connectionPool);
settings.DisableDirectStreaming();
Conclusion
You can see that Elasticsearch APM tracking is really simple. However, it is also very helpful to see the details in Kibana APM for analysis. In the next article of this series, I will write how we can get the Serilog logs from .NET to Elasticsearch.
