Monitoring with Elastic APM .NET for a .NET Core REST service - Part 1
In this series, I will speak about application performance monitoring. For this, I want to use Elastic APM. I will create different services like REST, gRPC and GraphQl with C#. Also I will use different other connections to databases like MariaDB, Elasticsearch and Redis. The whole code you can find on Github.
What is APM?
APM stands for application performance monitoring and that is what it is. APM is the monitoring of the performance and availability of software applications. It collects different metrics like incoming and outcoming requests, database queries, external requests and many more. These metrics are very important if you want to improve the speed and the availability of your application.
I use the Elastic APM because I love the entire Elastic stack. Also it is really fast to start the whole Elastic stack. Elastic APM has a good integration in the Elasticsearch and Kibana. It is also free of charge.
Start of the Elastic Stack with APM
You can start really quick with an Elastic Stack with APM with Docker Compose. The documentation of Elastic is really great here and the following code is also from there.
Create a new file docker-compose.yml
 version: '2.2'
 services:
   apm-server:
     image: docker.elastic.co/apm/apm-server:7.12.0
     depends_on:
       elasticsearch:
         condition: service_healthy
       kibana:
         condition: service_healthy
     cap_add: ["CHOWN", "DAC_OVERRIDE", "SETGID", "SETUID"]
     cap_drop: ["ALL"]
     ports:
       - 8200:8200
     networks:
       - elastic
     command: >
       apm-server -e
         -E apm-server.rum.enabled=true
         -E setup.kibana.host=kibana:5601
         -E setup.template.settings.index.number_of_replicas=0
         -E apm-server.kibana.enabled=true
         -E apm-server.kibana.host=kibana:5601
         -E output.elasticsearch.hosts=["elasticsearch:9200"]
     healthcheck:
       interval: 10s
       retries: 12
       test: curl --write-out 'HTTP %{http_code}' --fail --silent --output /dev/null http://localhost:8200/

   elasticsearch:
     image: docker.elastic.co/elasticsearch/elasticsearch:7.12.0
     environment:
       - bootstrap.memory_lock=true
       - cluster.name=docker-cluster
       - cluster.routing.allocation.disk.threshold_enabled=false
       - discovery.type=single-node
       - "ES_JAVA_OPTS=-Xms2048m -Xmx2048m"
     ulimits:
       memlock:
         hard: -1
         soft: -1
     volumes:
       - esdata:/usr/share/elasticsearch/data
     ports:
       - 9200:9200
     networks:
       - elastic
     healthcheck:
       interval: 20s
       retries: 10
       test: curl -s http://localhost:9200/_cluster/health | grep -vq '"status":"red"'

   kibana:
     image: docker.elastic.co/kibana/kibana:7.12.0
     depends_on:
       elasticsearch:
         condition: service_healthy
     environment:
       ELASTICSEARCH_URL: http://elasticsearch:9200
       ELASTICSEARCH_HOSTS: http://elasticsearch:9200
     ports:
       - 5601:5601
     networks:
       - elastic
     healthcheck:
       interval: 10s
       retries: 20
       test: curl --write-out 'HTTP %{http_code}' --fail --silent --output /dev/null http://localhost:5601/api/status

 volumes:
   esdata:
     driver: local

 networks:
   elastic:
     driver: bridge
Start Elastic Stack with
docker-compose up- After a while Elasticsearch, Kibana and APM should have started. You can open and test it with this urls
- Elasticsearch - http://localhost:9200/
- Kibana - http://localhost:5601/
- APM - http://localhost:8200/
Use Elastic APM .NET in .NET Core
I created a project where you can find places from OpenStreetMap. I used the open-source API Nominatim for this. Important: That is only a test project and not more. Please use the API according to the appropriate rules.
It is really easy to configure the APM in the .NET application. You can also use here the documentation of the Kibana UI. The whole .NET APM documentation you can find here.
- Add the NuGet package that you need to the .NET project per UI or with NuGet Package Manager
Install-Package Elastic.Apm.NetCoreAll -Version 1.9.0. I use the Elastic.Apm.NetCoreAll package here because I use later also Entity Framework, Elasticsearch, Redis and so on. Now you can configure it in the
Startup.cspublic void Configure(IApplicationBuilder app, IWebHostEnvironment env) { app.UseAllElasticApm(Configuration); // ... }Also we need the configuration of the settings in the
appsettings.json. I added it to theappsettings.Development.jsonbecause the configuration can be different from the environments.{ "Logging": { "LogLevel": { "Default": "Information", "Microsoft": "Warning", "Microsoft.Hosting.Lifetime": "Information" } }, "ElasticApm": { "SecretToken": "", "ServerUrl": "http://localhost:8200", "ServiceName": "RestService", "Environment": "development" } }The SecretToken is here empty because this is the fastest way to start. But normally you should create a Secrete Token with some REST queries and then use it here.
Now start the .NET application, load the Kibana objects and launch APM.

Results in Kibana
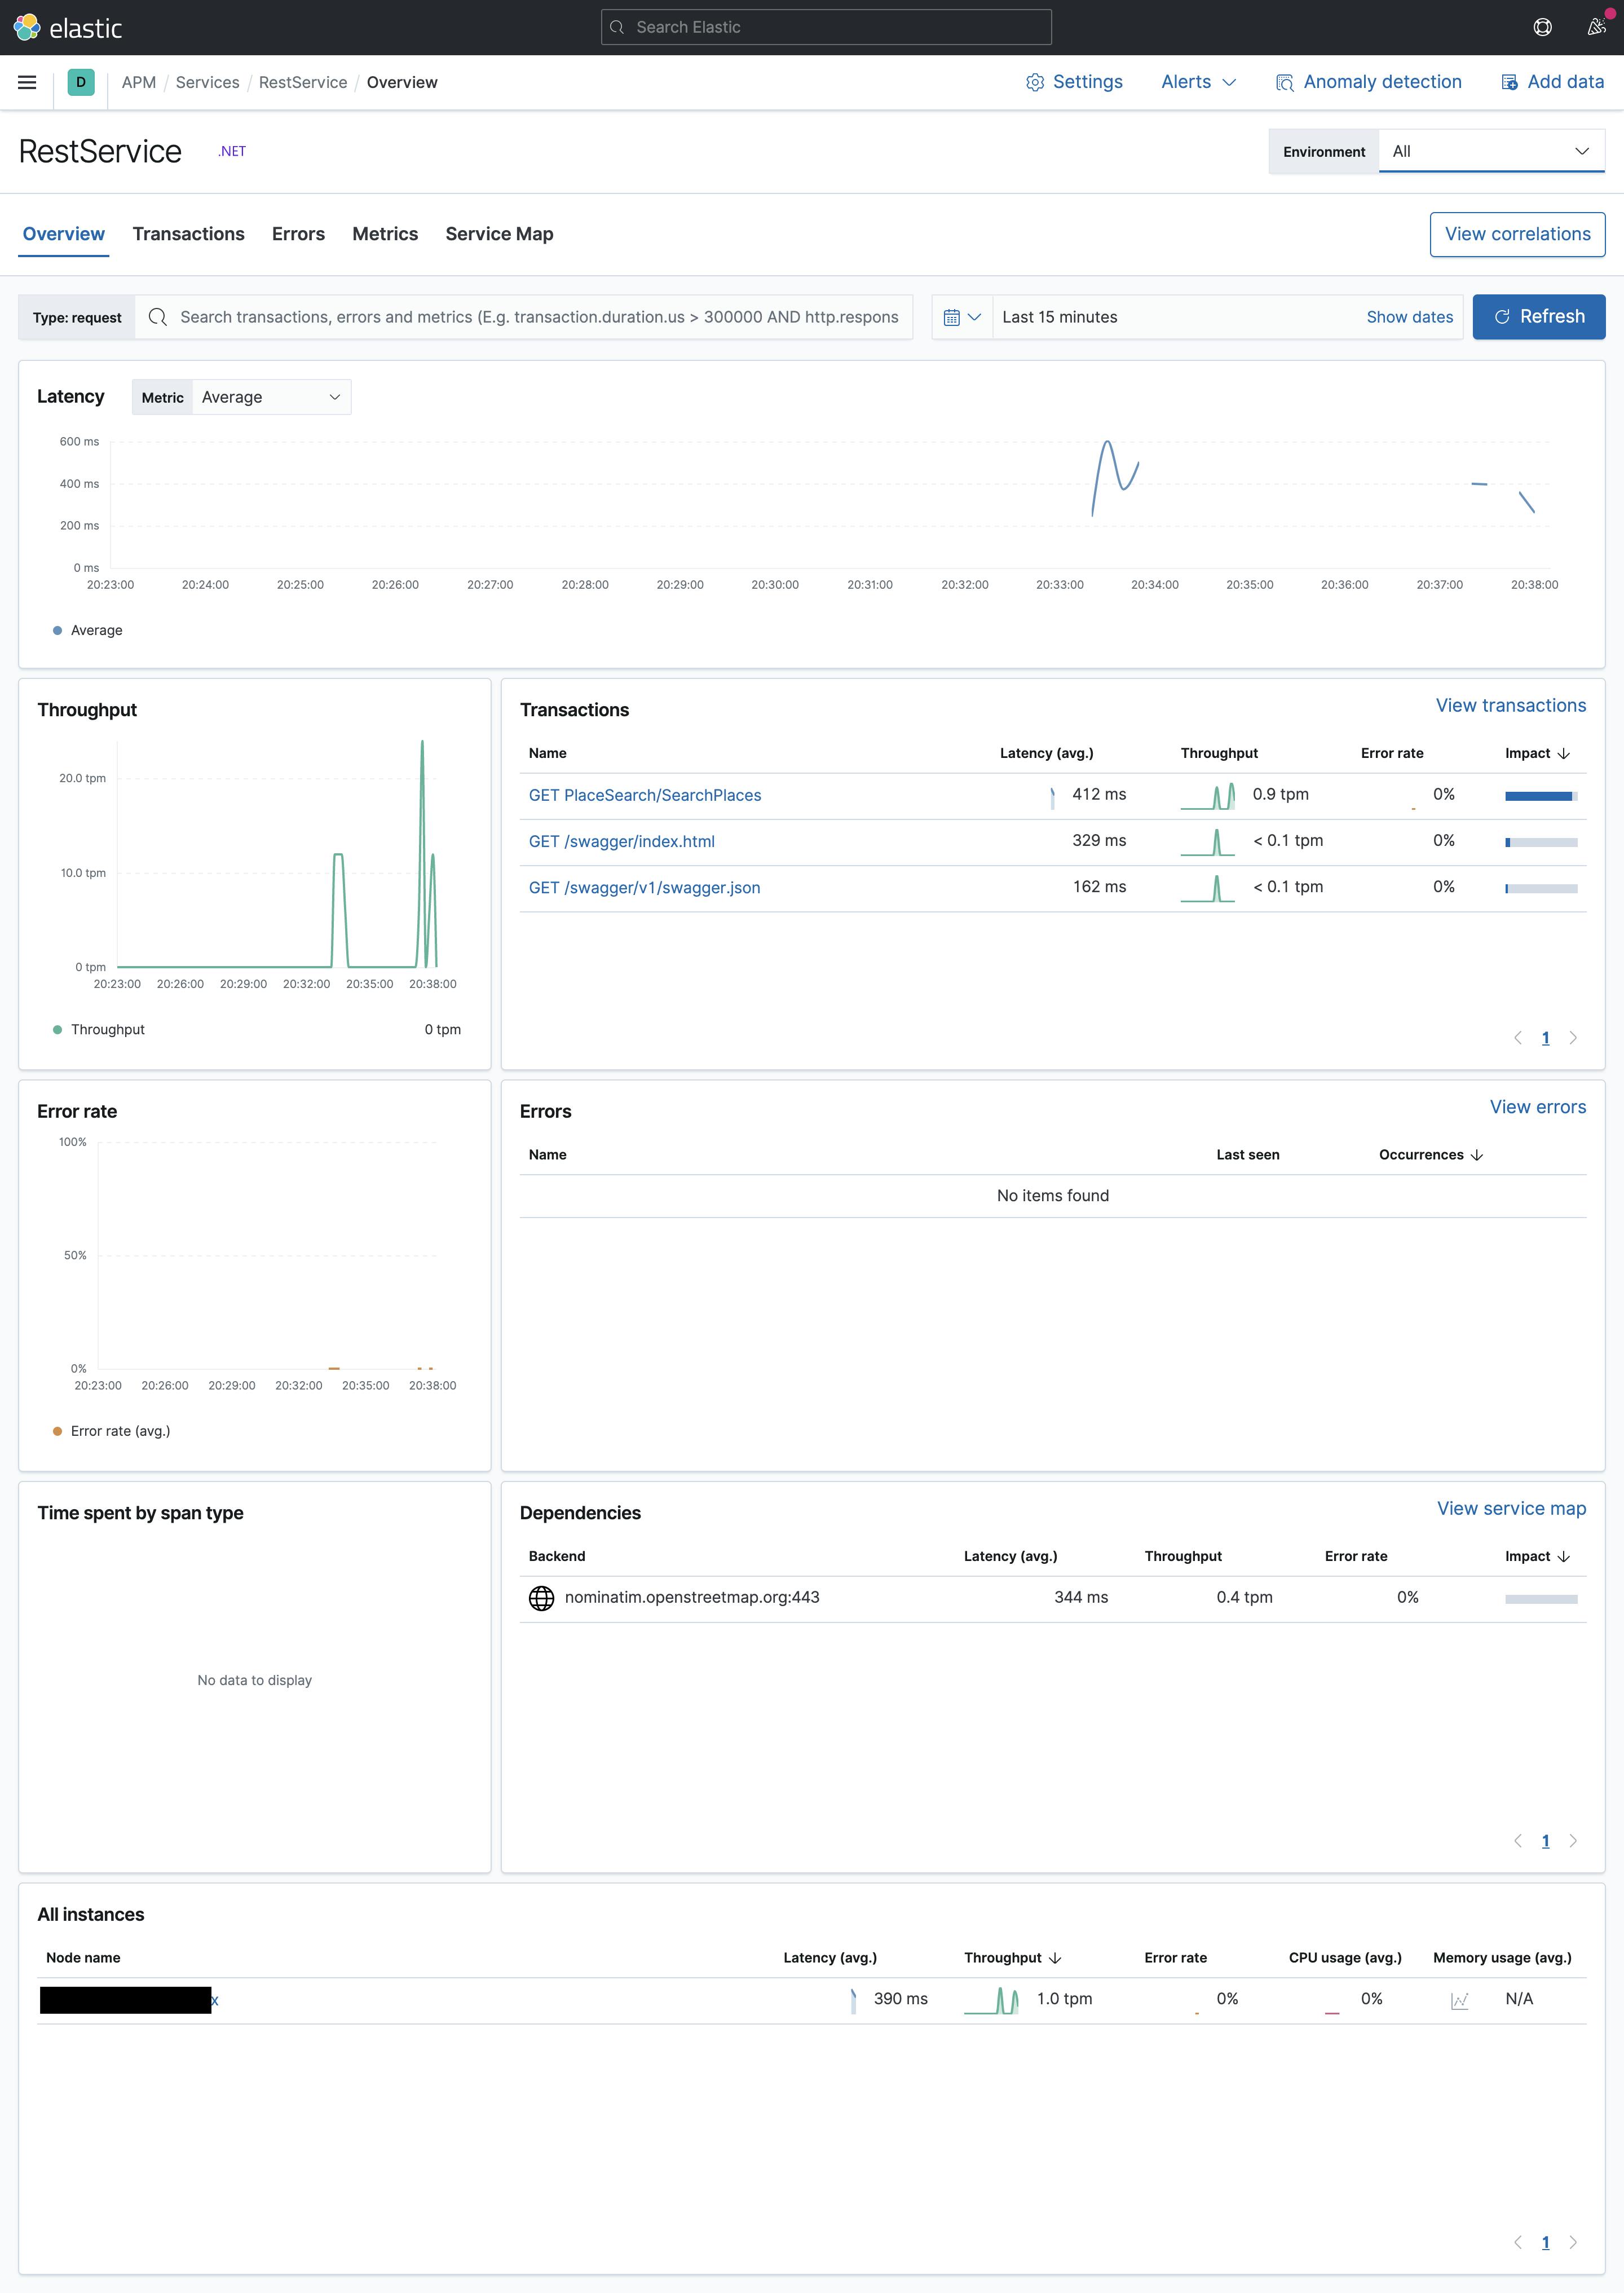
If everything was successful, then you should see the following dashboard.

Here do you have different metrics for your service. All details of the metrics you can read at the Elastic documentation. In my example, you can see that I did some test queries GET PlaceSearch/SearchPlaces. Also you can see external dependency to Nominatim [nominatim.openstreetmap.org:443](http://nominatim.openstreetmap.org:443) and how long it took.
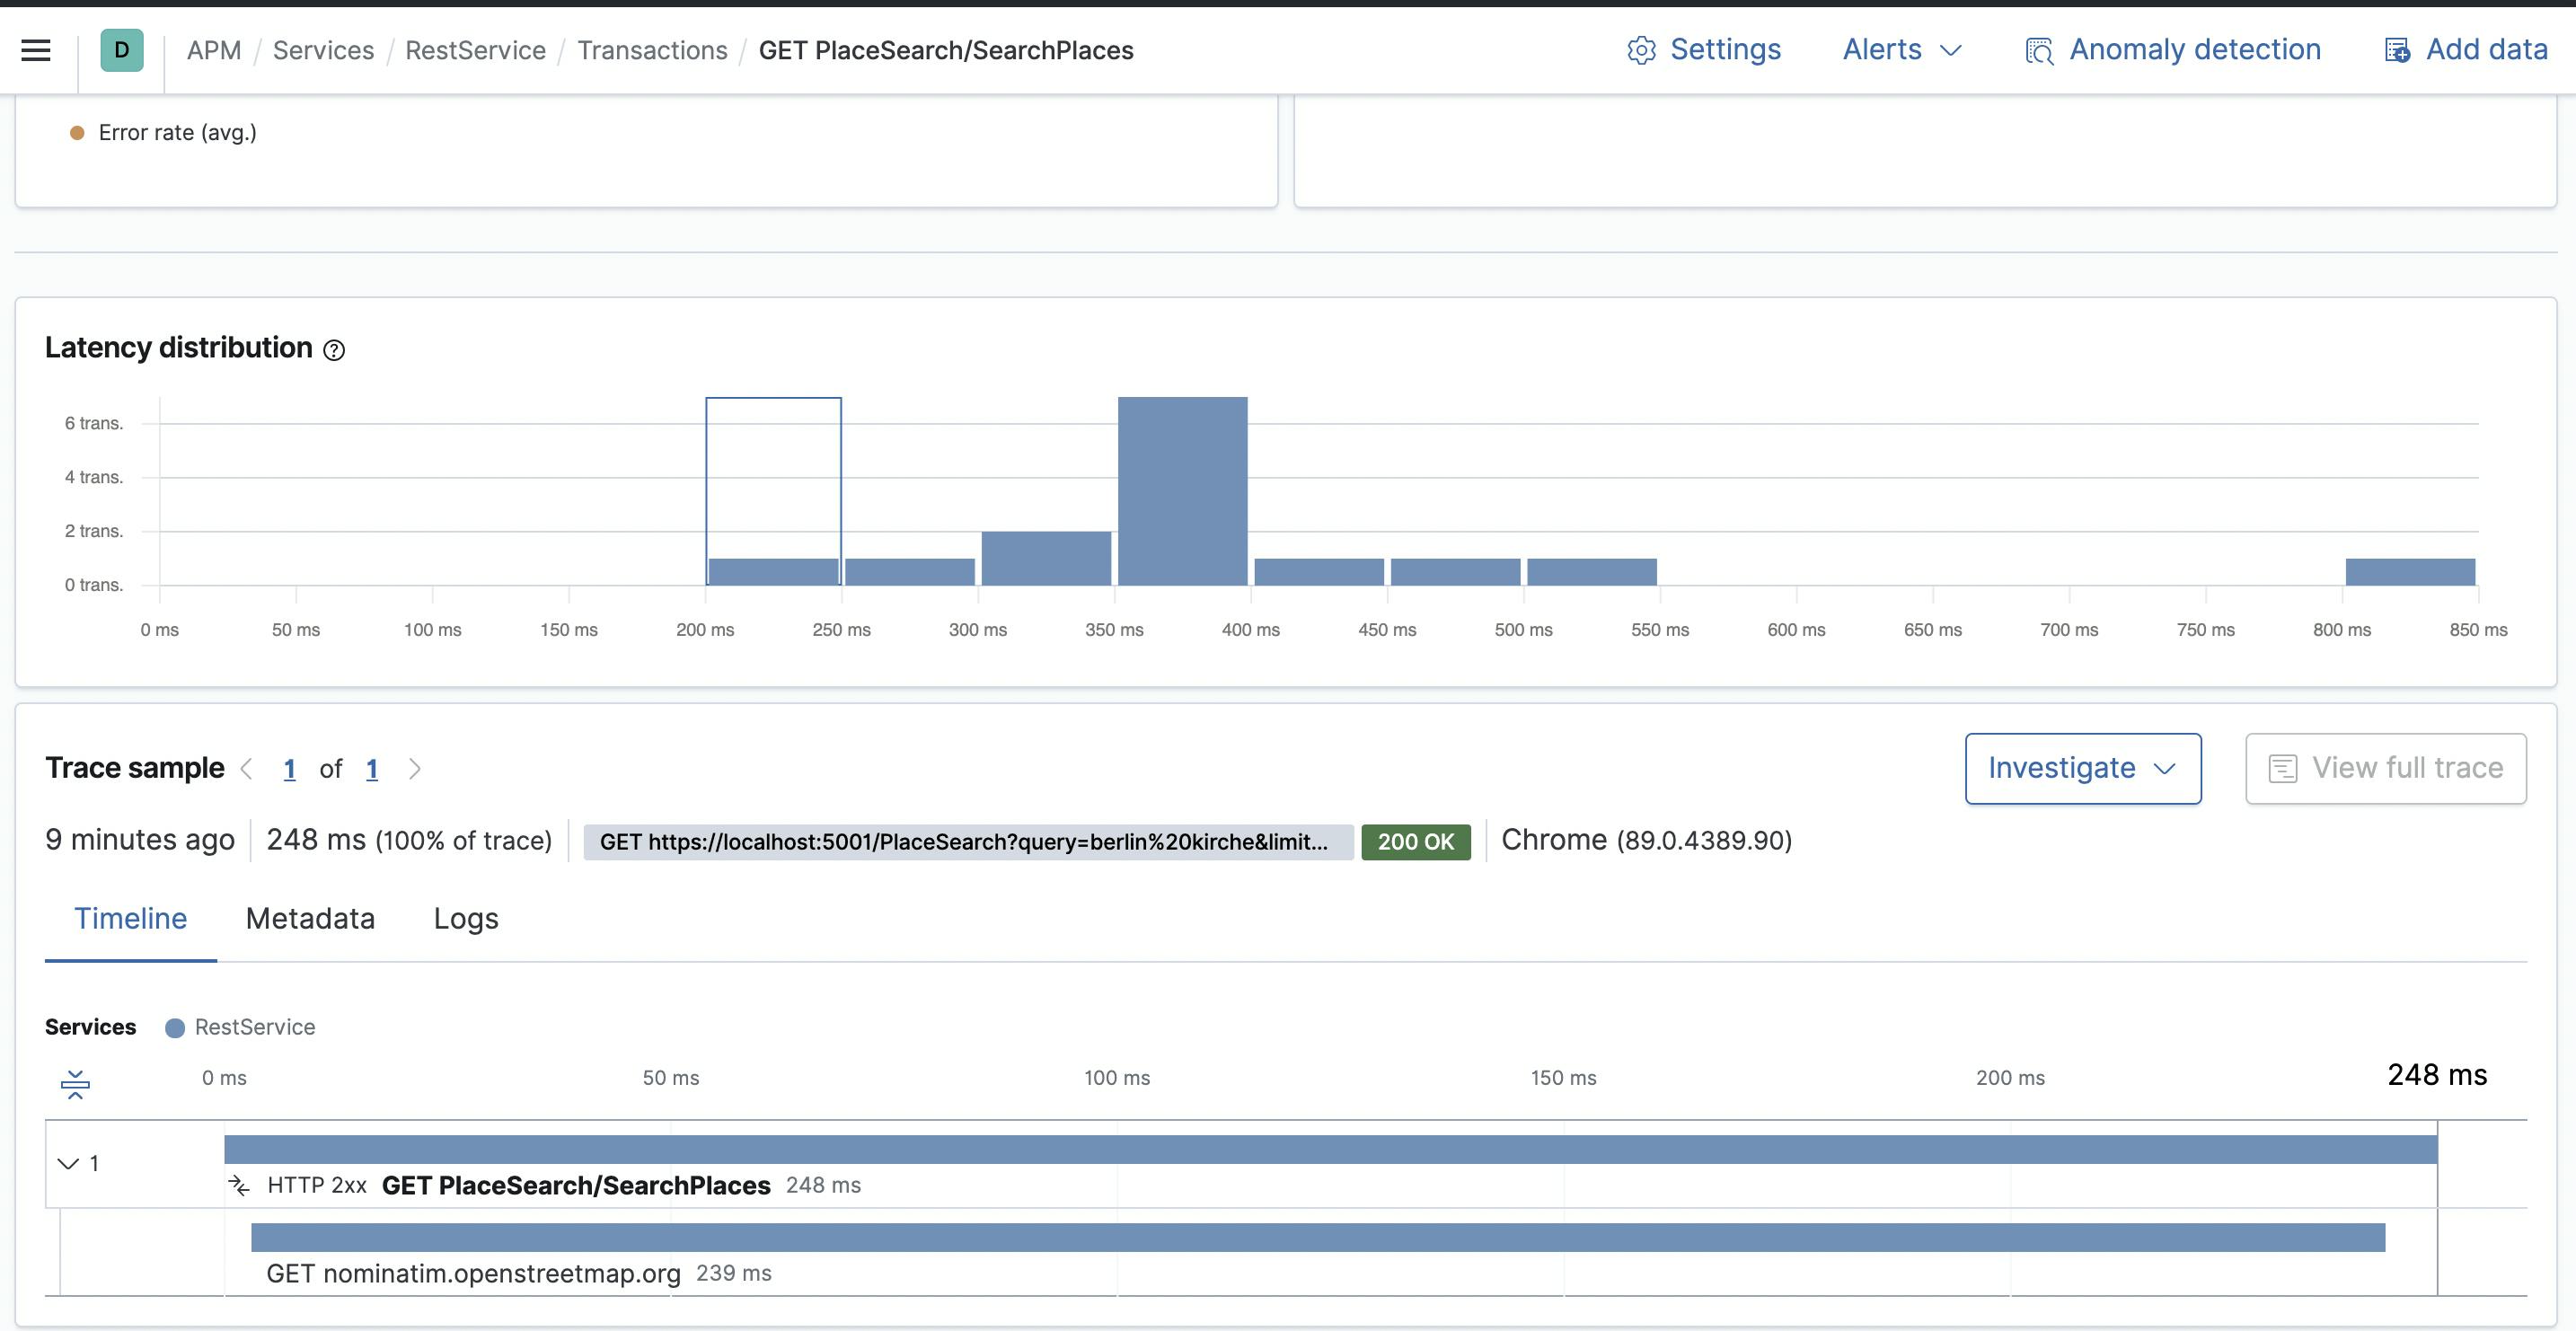
Now you can dive into a transaction and check more details. Here you can see, that the longest transaction is the external call to Nominatim.

Conclusion
In this article, you have learned the basics of integrating and configuring Elastic APM .NET in your application. In the next article, I will use the MariaDB with EF Core and then we can look at the results in Kibana.
