log4net logs to Elasticsearch - Part 1
Tutorial on how you can send your log4net logs to Elasticsearch with Filebeat and Logstash.
It gives many ways to centralize the logs. One way is to take the log files with Filebeat, send it to Logstash and split the fields and then send the results to Elasticsearch. And this way I describe here. All the code is on Github. Have fun :)
Prepare a ELK stack with Docker
If you have an existing started ELK stack, then you can skip this chapter. The fastest way to start a ELK stack is to use Docker.
Most code of the Docker Compose is from Elastic and Github. I like the Elastic documentation. If you are unclear about Elasticsearch, Logstash, Kibana or the other tools, the Elastic documentation should be the first place to go.
Create a
docker-compose.ymlfile with the following content. Some annotations from meversion: '2.2' services: es01: image: docker.elastic.co/elasticsearch/elasticsearch:7.11.1 container_name: es01 environment: - node.name=es01 - cluster.name=es-docker-cluster - cluster.initial_master_nodes=es01 - bootstrap.memory_lock=true - "ES_JAVA_OPTS=-Xms2048m -Xmx2048m" ulimits: memlock: soft: -1 hard: -1 volumes: - data01:/usr/share/elasticsearch/data ports: - 9200:9200 networks: - elastic kib01: image: docker.elastic.co/kibana/kibana:7.11.1 container_name: kib01 ports: - 5601:5601 environment: ELASTICSEARCH_URL: http://es01:9200 ELASTICSEARCH_HOSTS: '["http://es01:9200"]' networks: - elastic depends_on: - es01 log01: image: docker.elastic.co/logstash/logstash:7.11.1 container_name: log01 volumes: - type: bind source: ./logstash/config/logstash.yml target: /usr/share/logstash/config/logstash.yml read_only: true - type: bind source: ./logstash/pipeline target: /usr/share/logstash/pipeline read_only: true ports: - 9600:9600 - 5044:5044 environment: ELASTICSEARCH_URL: http://es01:9200 ELASTICSEARCH_HOSTS: '["http://es01:9200"]' networks: - elastic depends_on: - es01 volumes: data01: driver: local networks: elastic: driver: bridge- I reduced from 3 to 1 Elasticsearch node, because I don't need 3 nodes.
- I changed Xms and Xmx from Elasticsearch to 2 GB. I like that an Elasticsearch node is fast enough. But make sure that your Docker engine has enough resources available.
I added
logstash01to the Docker Compose.- Create the directories
logstash/configandlogstasth/pipeline. Add
logstash/config/logstash.ymlfilehttp.host: "0.0.0.0" xpack.monitoring.elasticsearch.hosts: [ "http://es01:9200" ] xpack.monitoring.enabled: true config.reload.automatic: trueAdd
logstash/pipeline/logsToElasticsearch.configfile so that it works. We will change the content later.input { beats { port => 5044 } } output { elasticsearch { hosts => "es01:9200" } }
- Create the directories
Run
docker-composeto start the docker containers with Elasticsearch, Logstash and Kibana.docker-compose upNow is the ELK stack started and ready. You can now open Kibana and see if everything works http://localhost:5601/.
Prepare Elasticsearch log index
In order to be able to filter optimally later, you should definitely create a template for the mapping of the log indexes before. I used many things of the default template of Filebeat. I downloaded it manually and then removed not used fields and added some important fields for the logs.
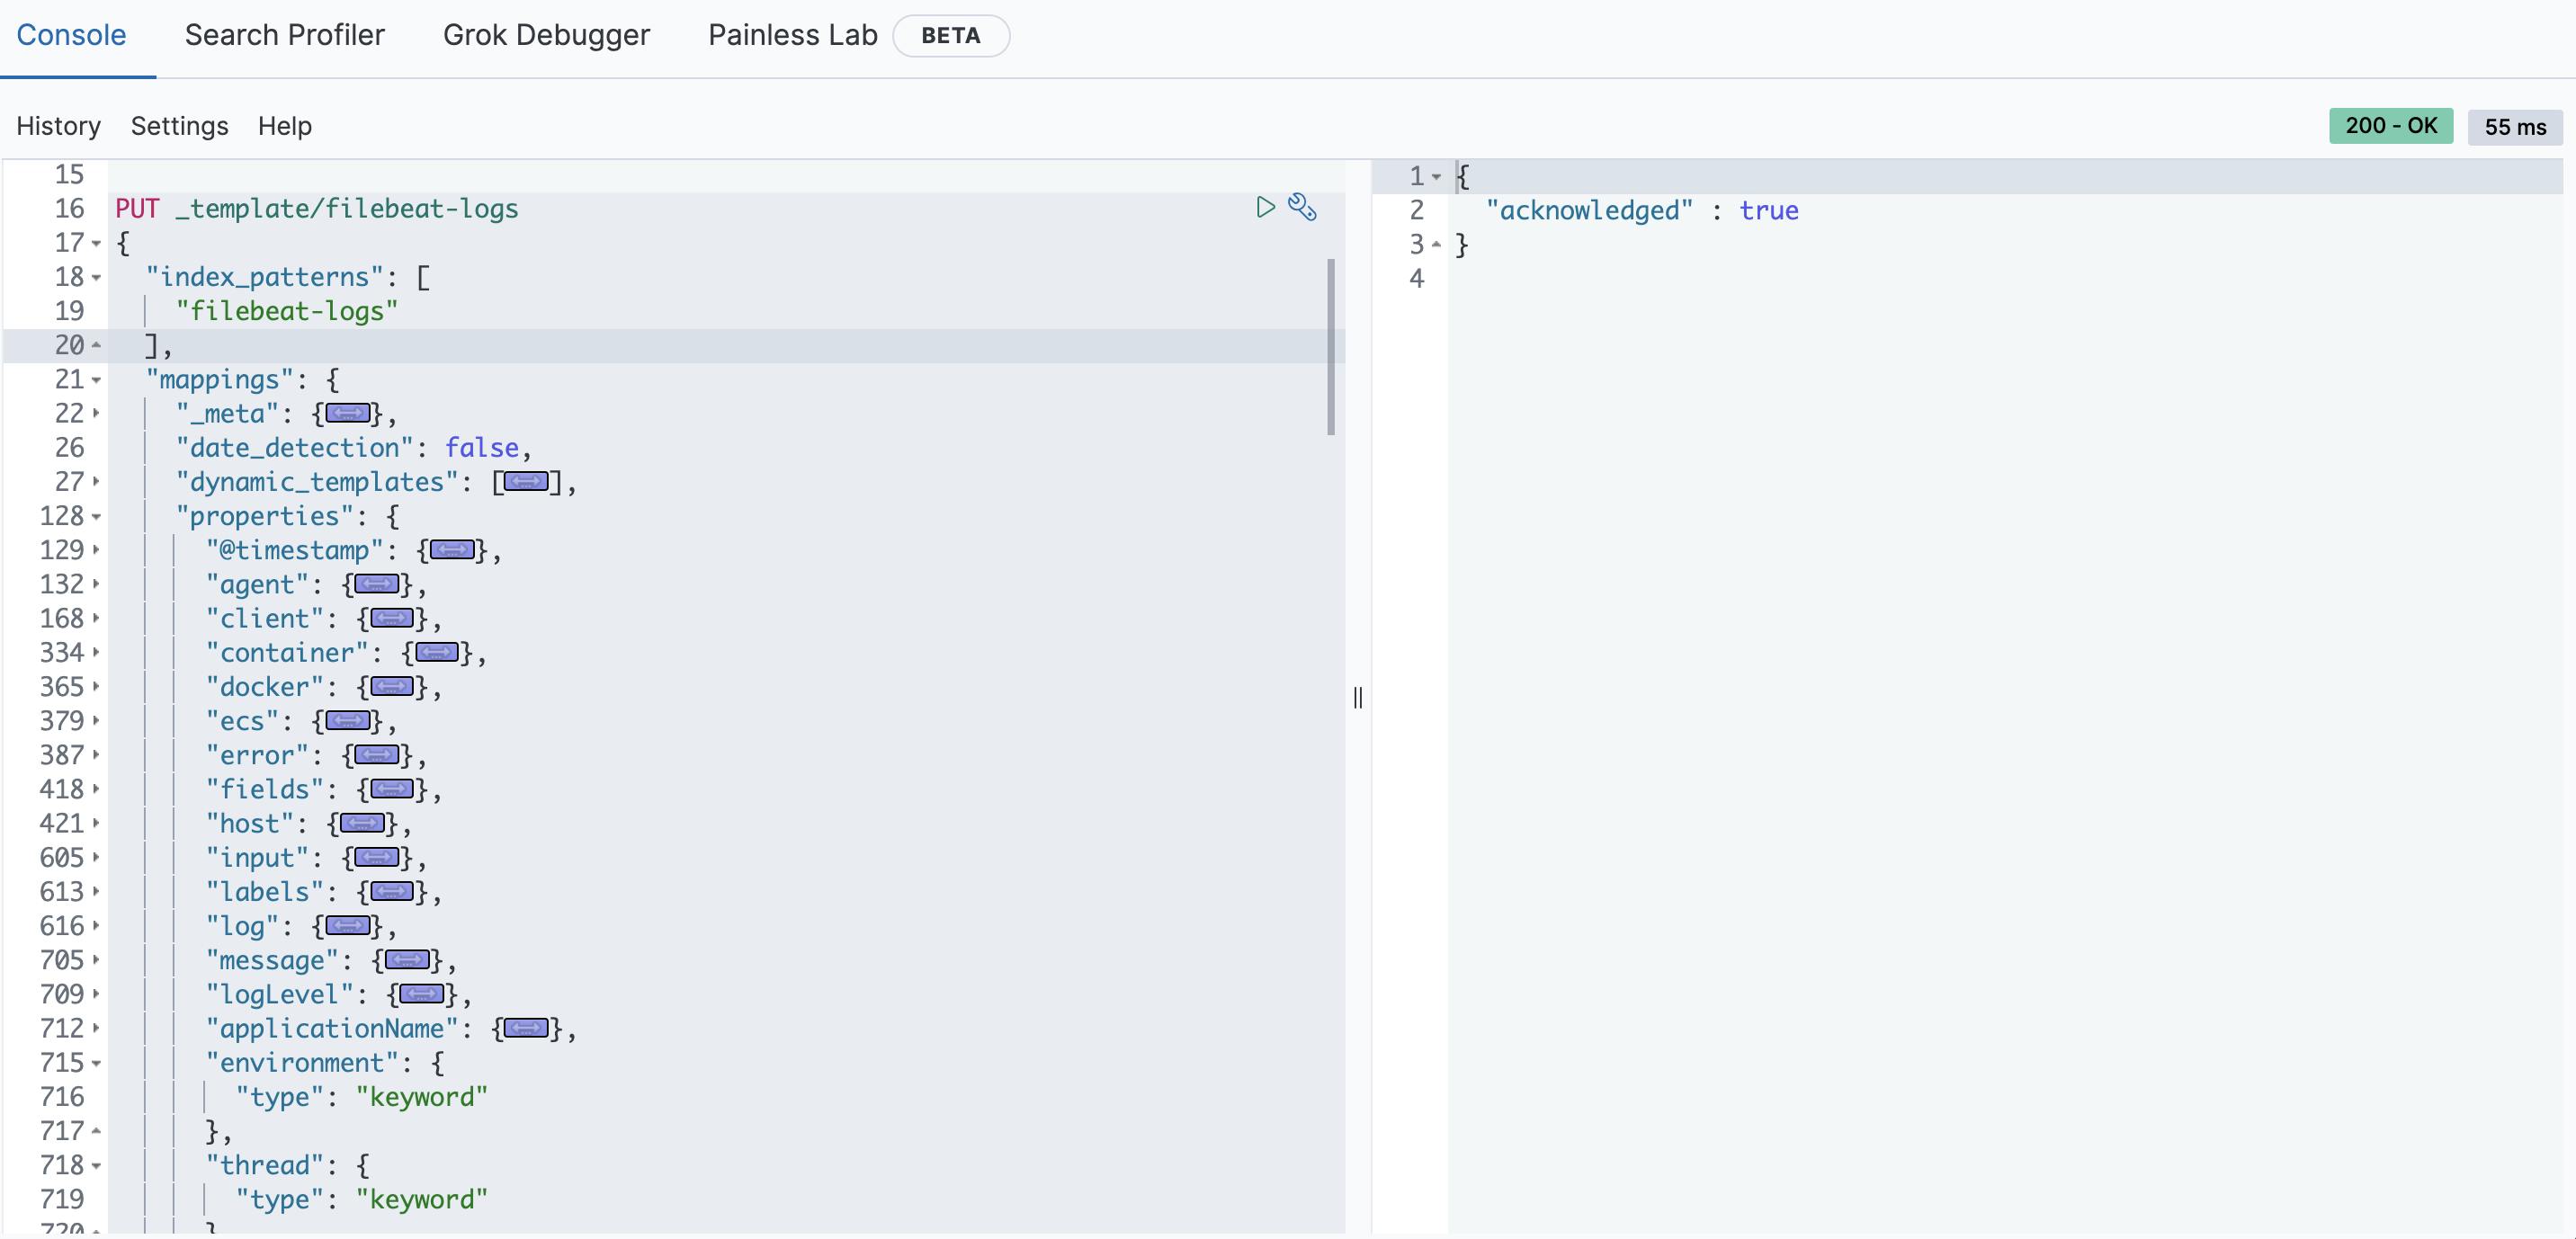
Add the template to Elasticsearch with curl, Kibana or any other tool. You can find the full template in Github.
PUT _template/filebeat-logs
{
  "index_patterns": [
    "filebeat-logs"
  ],
  "mappings": {
    "_meta": {
      "beat": "filebeat",
      "version": "7.11.1"
    },
    ...
    "properties": {
      "@timestamp": {
        "type": "date"
      },
      ...
      "message": {
        "norms": false,
        "type": "text"
      },
      "logLevel": {
        "type": "keyword"
      },
      "applicationName": {
        "type": "keyword"
      },
      "environment": {
        "type": "keyword"
      },
      "thread": {
        "type": "keyword"
      },
      "class": {
        "type": "keyword"
      },
      "applicationTimestamp": {
        "type": "date"
      }
      ...
    }
  }
}

Logstash configuration
In order to better evaluate the log messages later, we will use Logstash to split the messages. For this we will use the Grok filter. But of course, you can also use Elasticsearch Ingest Pipeline. Maybe I'll try that out next time.
Now you must change the content of the file logstash/pipeline/logsToElasticsearch.config to:
input {
    beats {
        port => 5044
    }
}

filter {
    grok {
        match => { "message" => "%{TIMESTAMP_ISO8601:applicationTimestamp} %{DATA:applicationName} %{DATA:environment} \[%{DATA:thread}\] %{LOGLEVEL:logLevel} %{DATA:class} - %{GREEDYDATA:message}" }
        overwrite => [ "message" ]
    }

    date {
        match => [ "applicationTimestamp", "ISO8601" ]
        target => "applicationTimestamp"
    }
}

output {
    if "_grokparsefailure" in [tags] {
        elasticsearch {
            hosts => "es01:9200"
            index => "filebeat-logs-error"
        }
      } else {
        elasticsearch {
            hosts => "es01:9200"
            index => "filebeat-logs"
        }
    }
}
- The input plugin beats is responsible to receive the log messages from Filebeat.
We use two filters
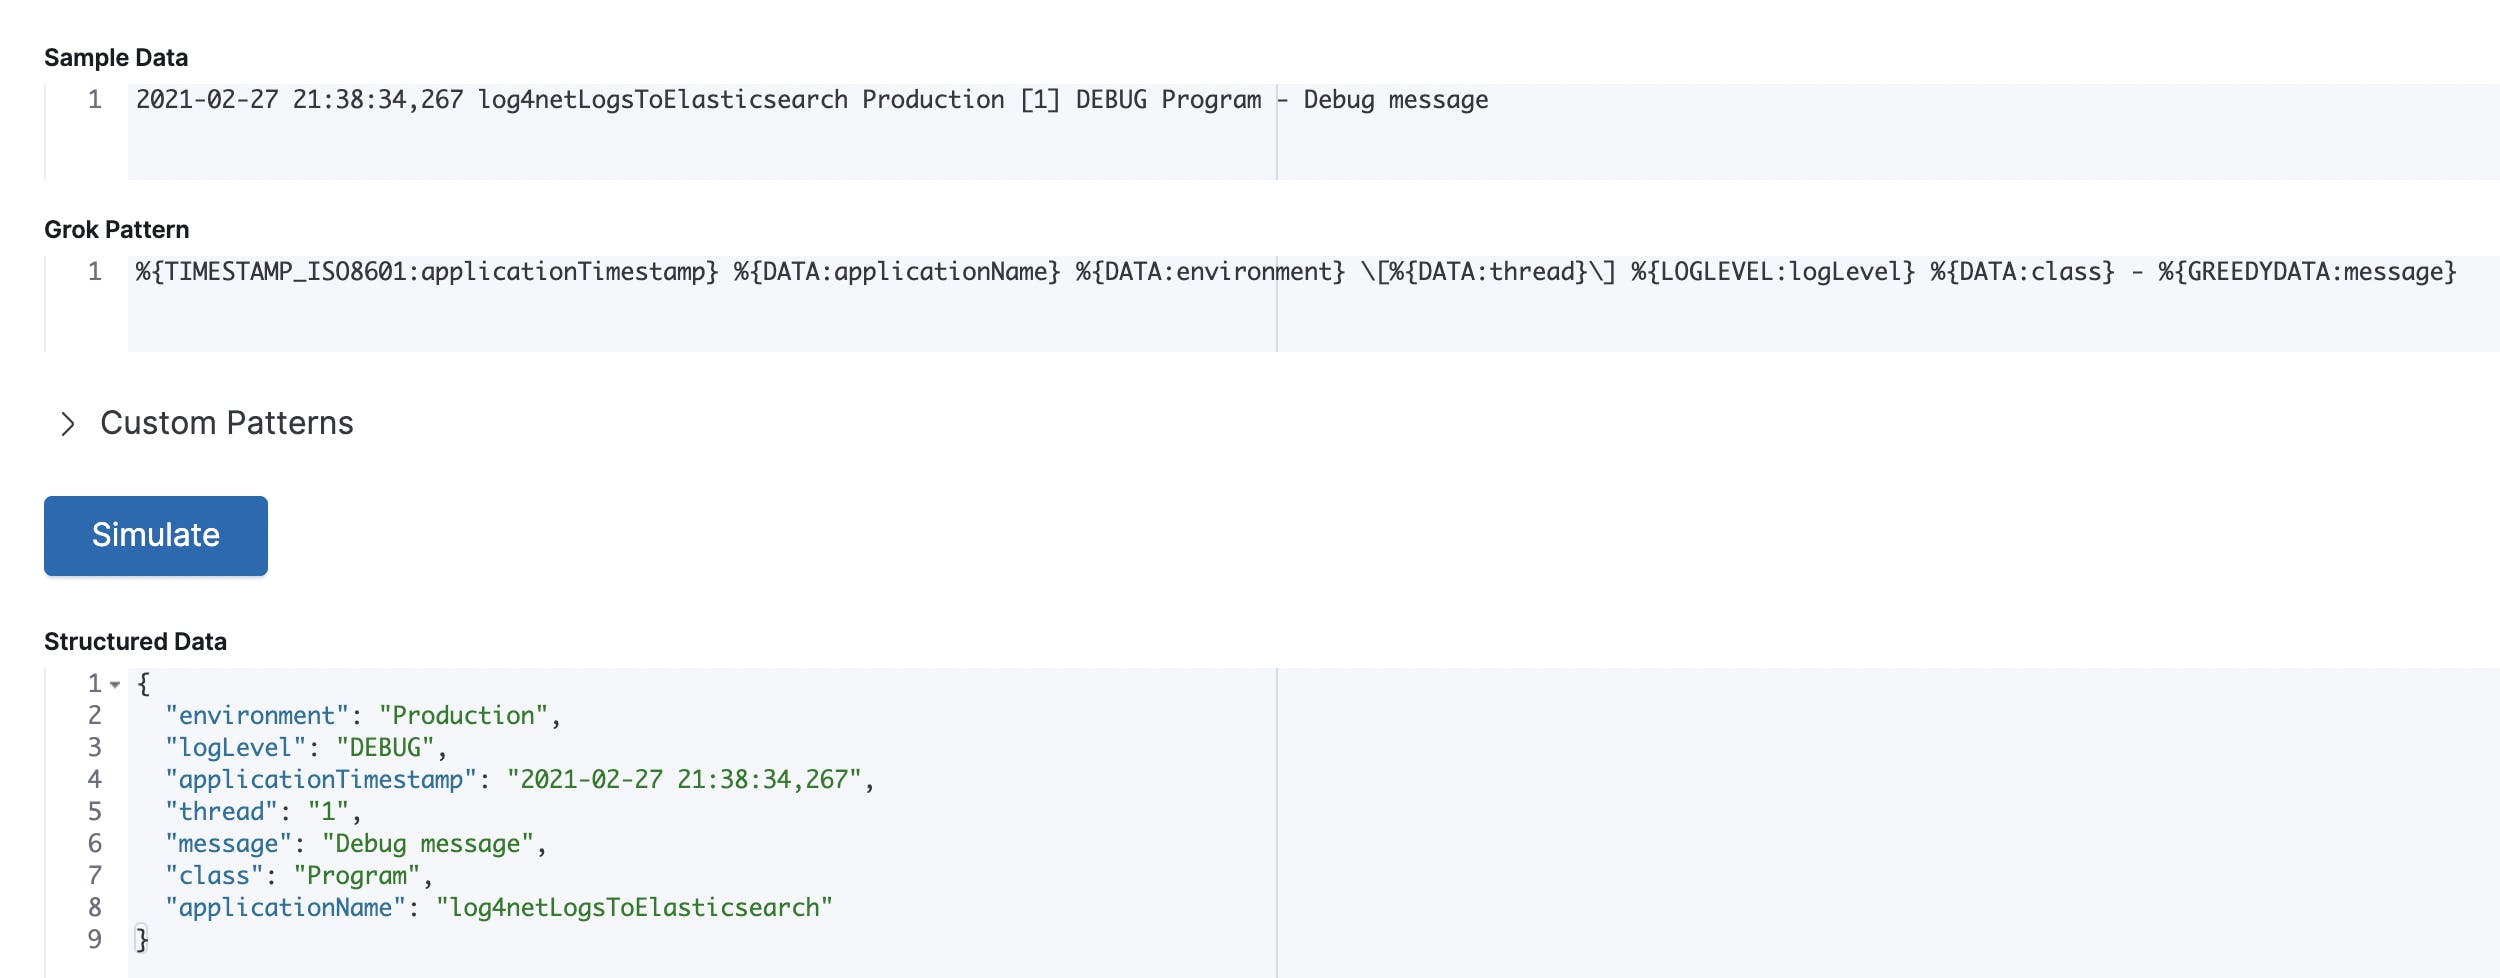
We use grok filter to split the log message into different fields. In the Github from Elastic you can find some good examples from Grok patterns. Here a picture to better understand then the input and the output.

Then we use the date filter, to set the correct date format for Elasticsearch.
- The output is divided into two Elasticsearch indexes. Because if a log message does not match the format, it should be written to the index filebeat-logs-error. This way you can better inform the developers who send wrong log messages.
If your ELK stack is still running, then the pipeline should automatically reload when you save the file.
Filebeat to collect and send log4net logs from .NET
I use here a simple .NET 5.0 console application to create some logs in log4net. But you can use all .NET platforms you want. You can even use any other programming languages or log frameworks. It doesn't matter in this case.
At the start, we need the .NET application with log4net logs. Good sites to configure log4net in dotnet are https://jakubwajs.wordpress.com or https://stackify.com.
- Create a .NET 5.0 console application in Visual Studio 2019.
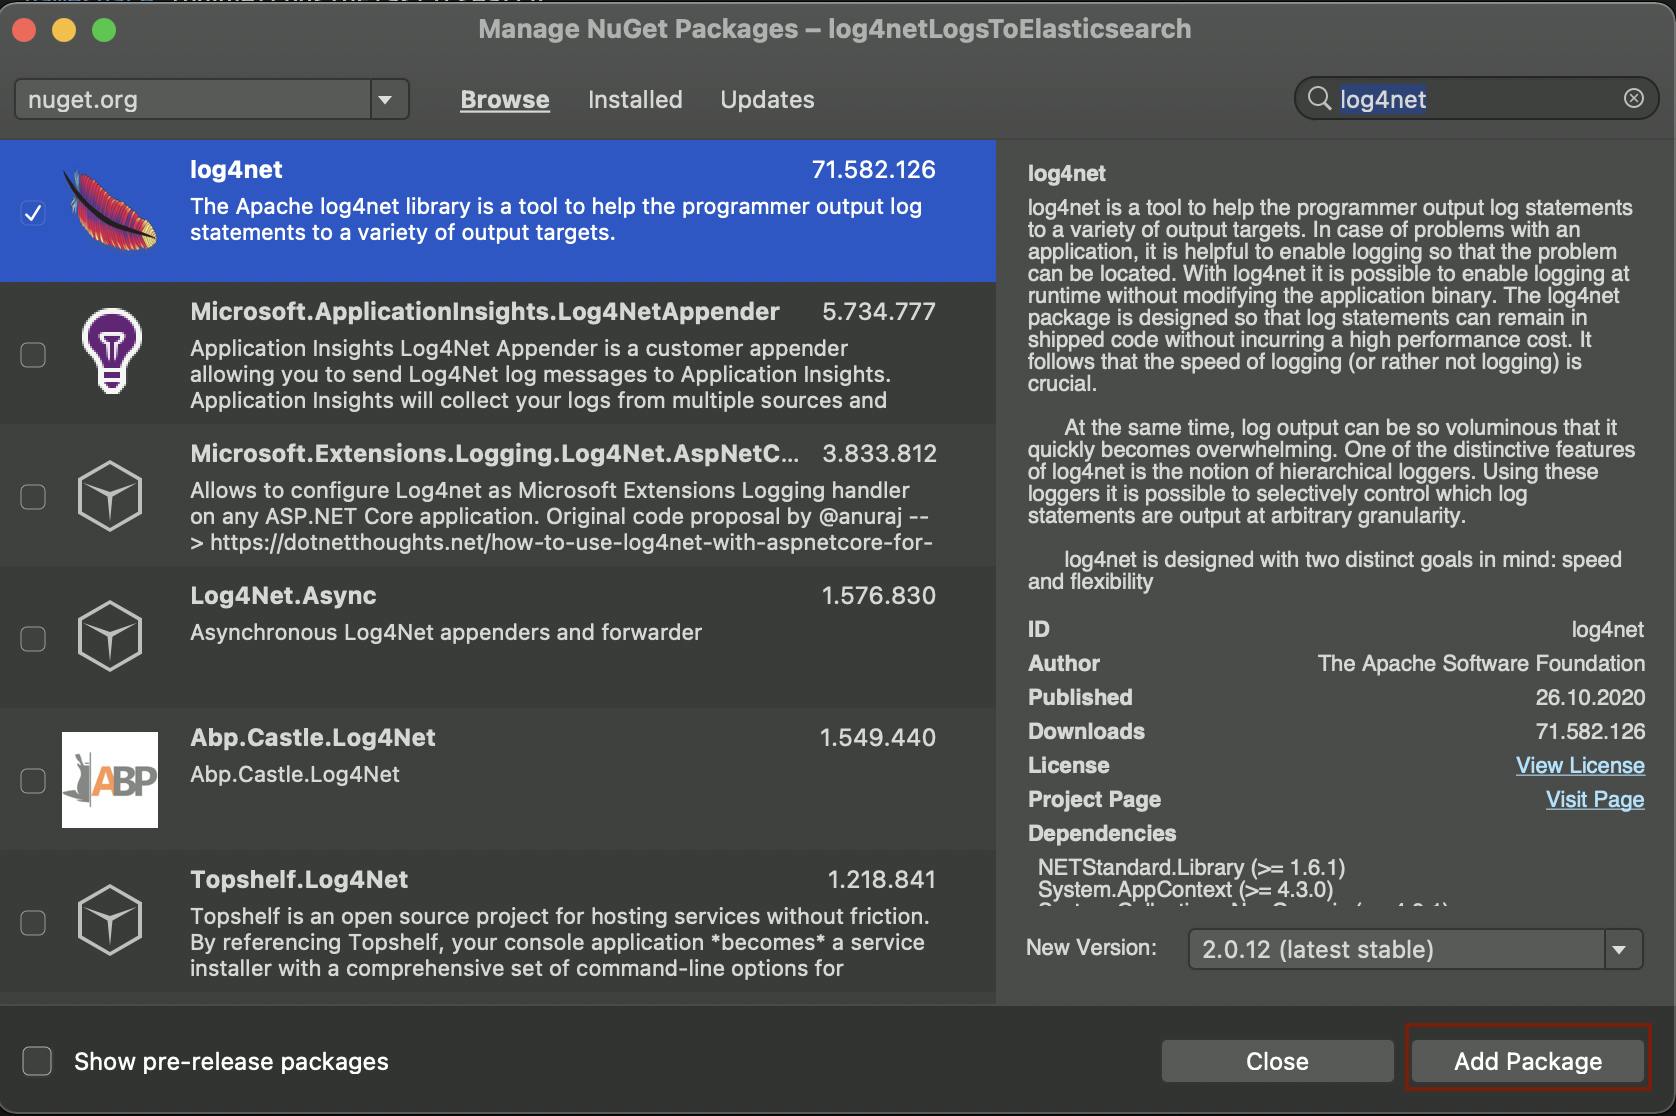
Add log4net to the project.
UI: Manage NuGet Packages --> Add Package

Terminal:
Install-Package Newtonsoft.Json
Add the
log4net.configfile to the project and change the propertyCopy to Output Directorybuild action toCopy if newer.The format of the fieldconversionPatternis very important because we use this format in the Logstash Grok filter to split the log message into different fields.<?xml version="1.0" encoding="UTF-8"?> <log4net> <root> <level value="ALL" /> <appender-ref ref="console" /> <appender-ref ref="file" /> </root> <appender name="console" type="log4net.Appender.ConsoleAppender"> <layout type="log4net.Layout.PatternLayout"> <conversionPattern value="%utcdate{ISO8601} log4netLogsToElasticsearch Production [%thread] %level %logger - %message%newline" /> </layout> </appender> <appender name="file" type="log4net.Appender.RollingFileAppender"> <file value="Log.log" /> <appendToFile value="true" /> <rollingStyle value="Size" /> <maxSizeRollBackups value="5" /> <maximumFileSize value="10MB" /> <staticLogFileName value="true" /> <layout type="log4net.Layout.PatternLayout"> <conversionPattern value="%utcdate{ISO8601} log4netLogsToElasticsearch Production [%thread] %level %logger - %message%newline" /> </layout> </appender> </log4net>You must read then the log4net config. Also, you can add some log messages. Here an example: I know, never use endless loops :)
 class Program
     {
         private static readonly ILog log = LogManager.GetLogger(nameof(Program));

         static void Main(string[] args)
         {
             var logRepository = LogManager.GetRepository(Assembly.GetEntryAssembly());
             XmlConfigurator.Configure(logRepository, new FileInfo("log4net.config"));

             Random random = new Random();

 // Endless loop to write logs over and over again.while (true)
             {
                 int logLevelRandom = random.Next(0, 100);
                 switch (logLevelRandom)
                 {
                     case < 50:
                         log.Debug("Debug message");
                         break;
                     case < 70:
                         log.Info("Info message");
                         break;
                     case < 85:
                         log.Warn("Warning!");
                         break;
                     case < 95:
                         log.Error("Error NullReferenceException",
                             new NullReferenceException("Everything is null"));
                         break;
                     default:
                         log.Fatal("Fatal error message", new Exception("Fatal exception"));
                         break;
                 }

                 Thread.Sleep(TimeSpan.FromMilliseconds(random.Next(200, 5000)));
             }
         }
     }
Now is the dotnet application prepared. Now we need Filebeat to collect the logs and send them to Logstash. Now you have different options to start Filebeat. You can start Filebeat directly on your computer or you can start it in a Docker Container, if your application also run in Docker. But you can also start Filebeat in Kubernetes and then so on. We will use Docker here.
Add a
dockerfilefile to your dotnet project.#See https://aka.ms/containerfastmode to understand how Visual Studio uses this Dockerfile to build your images for faster debugging.FROM mcr.microsoft.com/dotnet/runtime:5.0-buster-slim AS base #supervisor is being used to run multiple processes in the same containerRUN apt-get update && apt-get install -y supervisor RUN mkdir -p /var/log/supervisord # Install FilebeatRUN apt-get update RUN apt-get install -y wget RUN apt-get install -y gnupg2 RUN wget -qO - https://artifacts.elastic.co/GPG-KEY-elasticsearch | apt-key add - RUN echo "deb https://artifacts.elastic.co/packages/7.x/apt stable main" | tee -a /etc/apt/sources.list.d/elastic-7.x.list RUN apt-get install apt-transport-https RUN apt-get update && apt-get install filebeat WORKDIR /app FROM mcr.microsoft.com/dotnet/sdk:5.0-buster-slim AS build WORKDIR /src COPY log4netLogsToElasticsearch/log4netLogsToElasticsearch.csproj log4netLogsToElasticsearch/ RUN dotnet restore "log4netLogsToElasticsearch/log4netLogsToElasticsearch.csproj"COPY . . WORKDIR "/src/log4netLogsToElasticsearch"RUN dotnet build "log4netLogsToElasticsearch.csproj" -c Release -o /app/build FROM build AS publish RUN dotnet publish "log4netLogsToElasticsearch.csproj" -c Release -o /app/publish FROM base AS final WORKDIR /app # Copy configs into DockerCOPY log4netLogsToElasticsearch/filebeat.yml /etc/filebeat/filebeat.yml COPY log4netLogsToElasticsearch/supervisord.conf /etc/supervisor/conf.d/supervisord.conf COPY --from=publish /app/publish . ENTRYPOINT ["/usr/bin/supervisord", "-c", "/etc/supervisor/conf.d/supervisord.conf"]- I have added the section on installing Filebeat, as well as copying the configurations.
- To start Filebeat and dotnet together with supervisord in one Docker container I used the good article from Medium - Neeldeep.
Add the file
supervisord.conf[supervisord] nodaemon=true logfile=/var/log/supervisord/supervisord.log childlogdir=/app [program:dotnet] command=/usr/bin/dotnet log4netLogsToElasticsearch.dll directory=/app autostart=true autorestart=true [program:filebeat] command=/usr/share/filebeat/bin/filebeat -e -c /etc/filebeat/filebeat.ymlAdd the file
filebeat.ymlfilebeat.inputs: - type: log enabled: true paths: - /app/Log.log multiline.pattern: '^[0-9]{4}-[0-9]{2}-[0-9]{2}' multiline.negate: true multiline.match: after filebeat.config.modules: path: ${path.config}/modules.d/*.yml setup.template.settings: index.number_of_shards: 1 output.logstash: hosts: ["log01:5044"] processors: - add_host_metadata: when.not.contains.tags: forwarded - add_cloud_metadata: ~ - add_docker_metadata: ~ - add_kubernetes_metadata: ~- The multiline pattern is important for the exception or anything else on multiple lines. The pattern says that each new line starts with a date like 2021-02-28.
Build the Docker image.
docker build -f log4netLogsToElasticsearch/Dockerfile -t log4netlogstoes:latest .Run the container
docker run --net elk-stack-docker_elastic log4netlogstoes- Parameter --net is the network of the ELK stack from Docker Compose. You get the name if you run the command
docker network ls.
- Parameter --net is the network of the ELK stack from Docker Compose. You get the name if you run the command
Now the first log messages should be in Elasticsearch.
Results in Kibana
If everything works, you can now view the results in Kibana.
The first check is to see if the index exists.
 GET filebeat-logs/_search
 -->
 {
 "took" : 1,
 "timed_out" : false,
 "_shards" : {
     "total" : 1,
     "successful" : 1,
     "skipped" : 0,
     "failed" : 0
 },
 "hits" : {
     "total" : {
     "value" : 307,
     "relation" : "eq"
     },
     "max_score" : 1.0,
     "hits" : [
     {
         ...
     }
     ]
 }
 }
If the index not exists, then you must look to the different logs of the application like Filebeat, Logstash and so on. If the index exists, then you can add the index to the Kibana index patterns.
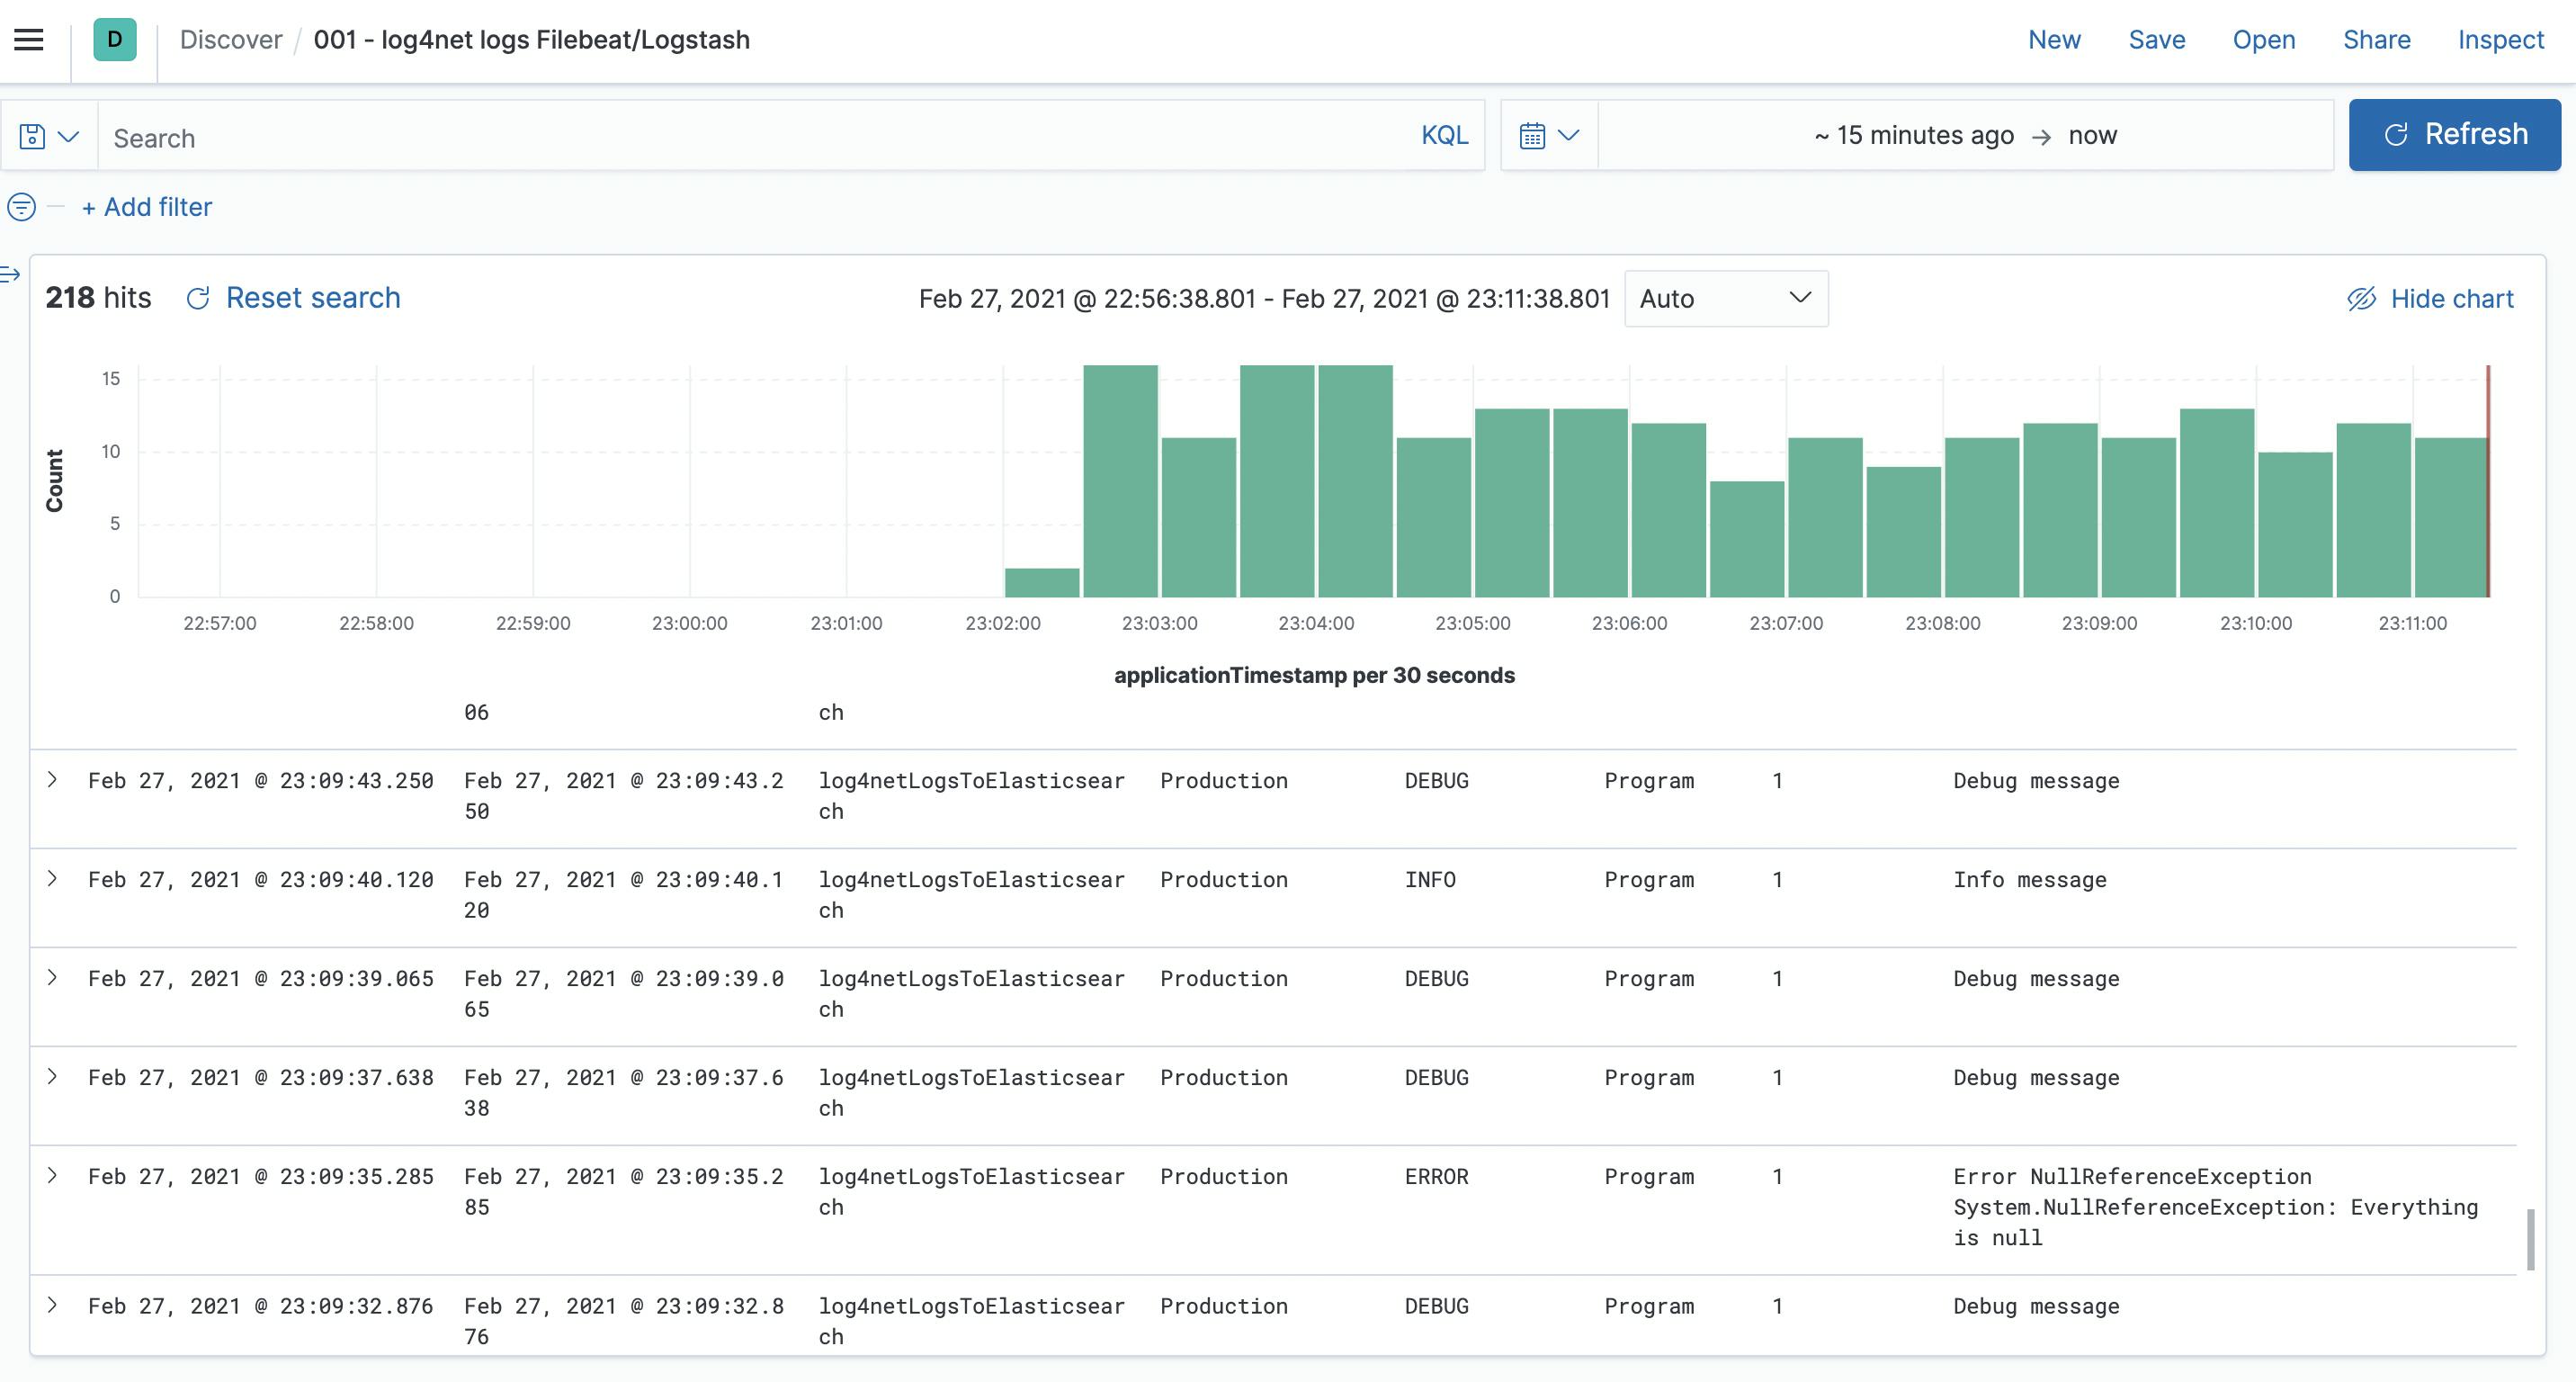
- The end results you can look then in the Discover view. Also, you can now create visualizations, dashboards and alerting.

Conclusion
In this tutorial, I tried to show you how to send logs to Elasticsearch using Filebeat via Logstash. I hope I could help you a little bit. Once you have central logging, you don't want to be without it. If you have any questions or suggestions, feel free to post them in the comments. In the next blog article, I use an Ingest Pipeline instead Logstash.
