

log4net logs to Elasticsearch - Part 2
Send log4net logs to Elasticsearch over an Ingest Pipeline with Filebeat.


In my previous article log4net logs to Elasticsearch I explained the workflow to push the log4net logs with Filebeat over Logstash to Elasticsearch. Now I will explain to push the logs with Filebeat directly to Elasticsearch with a Ingest Pipeline. Also I show the Kibana Log view. All the code is on Github. Much code is from the first article :)
Preparation of Elasticsearch and Kibana
Of course, we also need here a Elasticsearch and Kibana. In my last article, I described how you can start Elasticsearch and Kibana with Docker Compose. Also I described how should the mapping looks like for the best results.
Ingest pipeline
If Elasticsearch is started, then we can configure an Ingest Pipeline. Now you have different options to configure it. I show here in detail the option with Kibana, because with Kibana you can test directly the pipeline. But also I add the equivalent API request.
- Go to Kibana → Stack Management → Ingest Node Pipelines.
- Click on "Create a pipeline".
- Fill fields like Name and description.
Add a processor
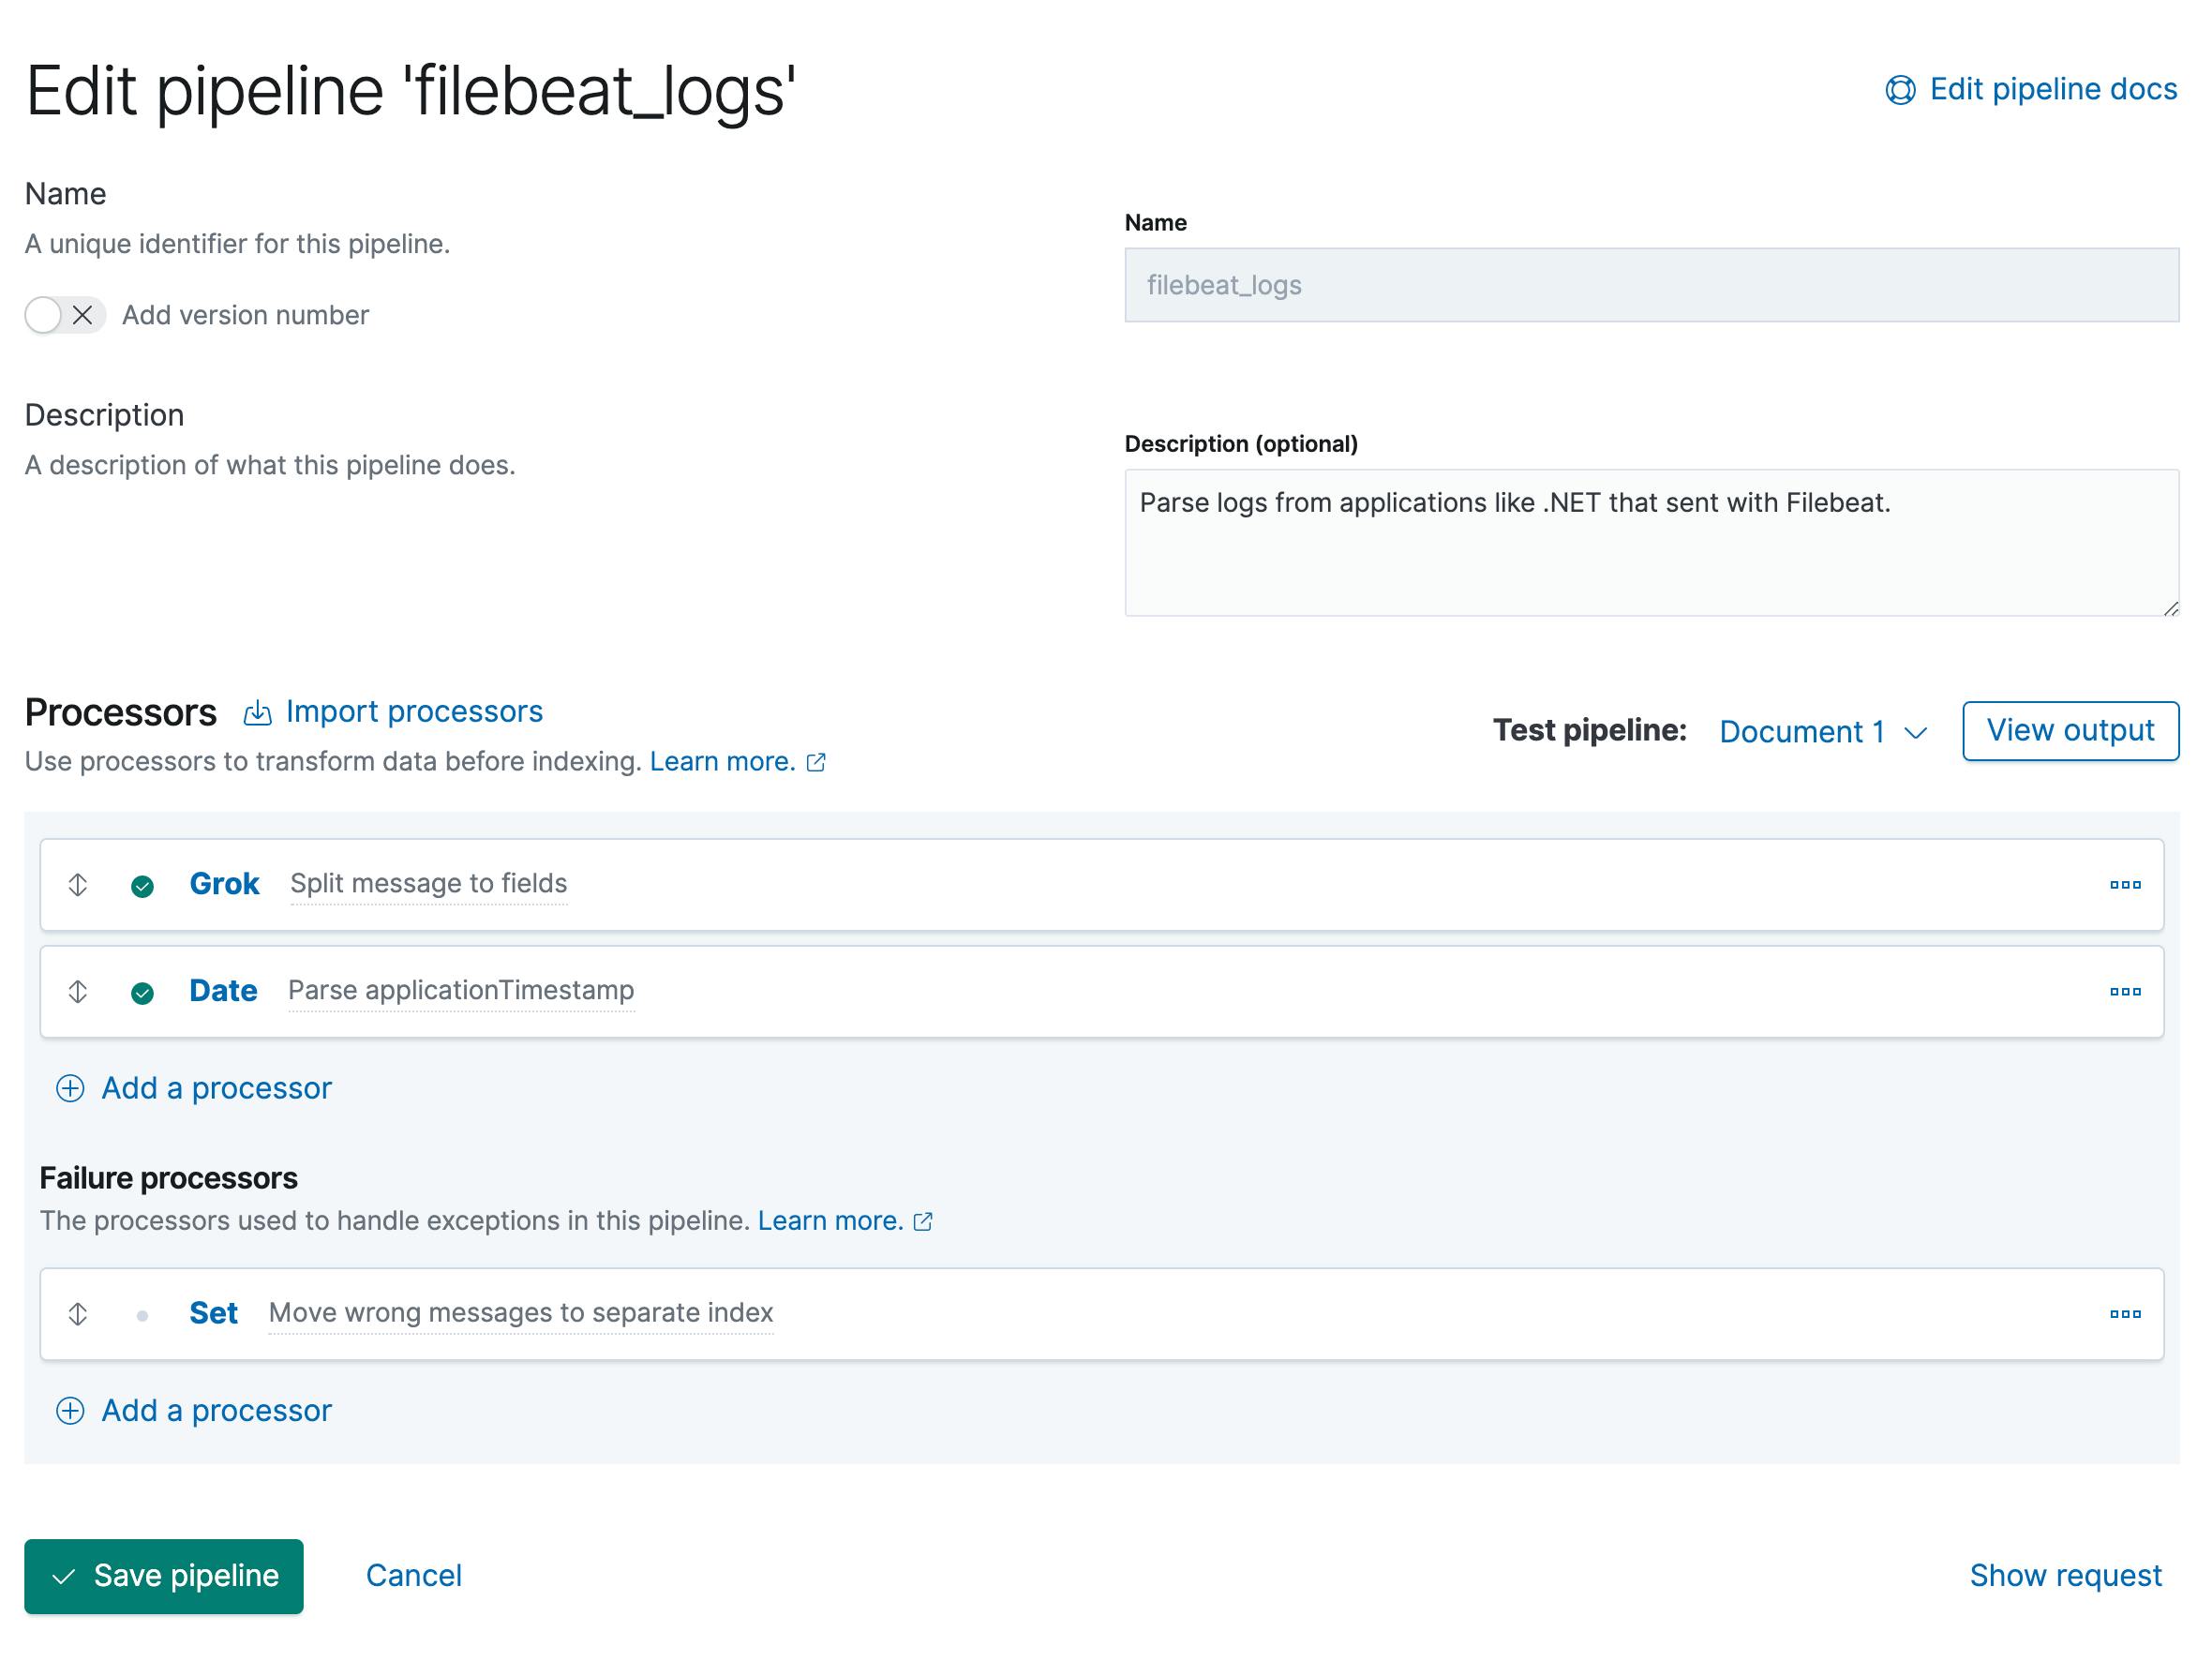
Grokwith the Fieldmessageand the Pattern%{TIMESTAMP_ISO8601:applicationTimestamp} %{DATA:applicationName} %{DATA:environment} \[%{DATA:thread}\] %{LOGLEVEL:logLevel} %{DATA:class} - %{GREEDYMULTILINE:message}This pattern split the log message into different fields. Important:
GREEDYMULTILINEis an own pattern definition, because the default pattern can't handle multi lines. Add also to Pattern definitions:{ "GREEDYMULTILINE" : "(.|\n)*" }Then add a second processor
Datewith the FieldapplicationTimestamp, the Formatsyyyy-MM-dd HH:mm:ss,SSSand the Target field toapplicationTimestamp. This processor is needed to correct the date format for Elasticsearch. Also you can use the default field@timestampand notapplicationTimestamp.- At the end we add a Failure processor
Set. The Field is_indexand the value is{{ _index}}-error. This is to handle the errors in the pipeline. Because if a log message does not match the format, it should be written to the index index-error. This way you can better inform the developers who send wrong log messages. To test the pipeline you can add a test document and then run the pipeline.
 [
   {
     "_index": "index",
     "_id": "id",
     "_source": {
       "message": "2021-02-27 21:38:34,267 log4netLogsToElasticsearch Production [1] DEBUG Program - Debug message\ntest new line"
     }
   }
 ]
Here a screenshot of the end result in Kibana:
Here is the equivalent API request to add the ingest pipeline:
PUT _ingest/pipeline/filebeat_logs
{
  "description": "Parse logs from applications like .NET that sent with Filebeat.",
  "processors": [
    {
      "grok": {
        "field": "message",
        "patterns": [
          "%{TIMESTAMP_ISO8601:applicationTimestamp} %{DATA:applicationName} %{DATA:environment} \\[%{DATA:thread}\\] %{LOGLEVEL:logLevel} %{DATA:class} - %{GREEDYMULTILINE:message}"
        ],
                "pattern_definitions": {
          "GREEDYMULTILINE": "(.|\n)*"
        },
        "description": "Split message to fields"
      }
    },
    {
      "date": {
        "field": "applicationTimestamp",
        "formats": [
          "yyyy-MM-dd HH:mm:ss,SSS"
        ],
        "target_field": "applicationTimestamp",
        "description": "Parse applicationTimestamp"
      }
    }
  ],
  "on_failure": [
    {
      "set": {
        "field": "_index",
        "value": "{{ _index}}-error",
        "description": "Move wrong messages to separate index"
      }
    }
  ]
}
Filebeat to collect and send logs
I collect in this example again logs from my .NET application with log4net. In my previous article you can find more details about .NET, log4net and the Dockerfile.
The important part of this article is, that you must change the output to Elasticsearch with your pipeline name/ id. In our case is it pipeline: filebeat_logs. Then you can also move to an own index like in our case filebeat-logs. But normally is it better to use also the version of Filebeat in it. More information here. If you change the index name, then you must also add the fields setup.template.name and setup.template.pattern. Also I disabled setup.ilm.enabled: false, because normally he would use ILM and one rollover index per day. This would also make more sense, but I have not used it here.
filebeat.inputs:
    - type: log
        enabled: true
        paths:
          - /app/Log.log

        multiline.pattern: '^[0-9]{4}-[0-9]{2}-[0-9]{2}'
        multiline.negate: true
        multiline.match: after

filebeat.config.modules:
    path: ${path.config}/modules.d/*.yml

setup.template.settings:
  index.number_of_shards: 1

setup.template.name: "filebeat-logs"
setup.template.pattern: "filebeat-logs"
setup.ilm.enabled: false

output.elasticsearch:
  hosts: ["http://es01:9200"]
  index: filebeat-logs
  pipeline: filebeat_logs

processors:
    - add_host_metadata:
        when.not.contains.tags: forwarded
    - add_cloud_metadata: ~
    - add_docker_metadata: ~
    - add_kubernetes_metadata: ~
Kibana & Logs
If you go now to Kibana then should also the results in the index filebeat-logs.
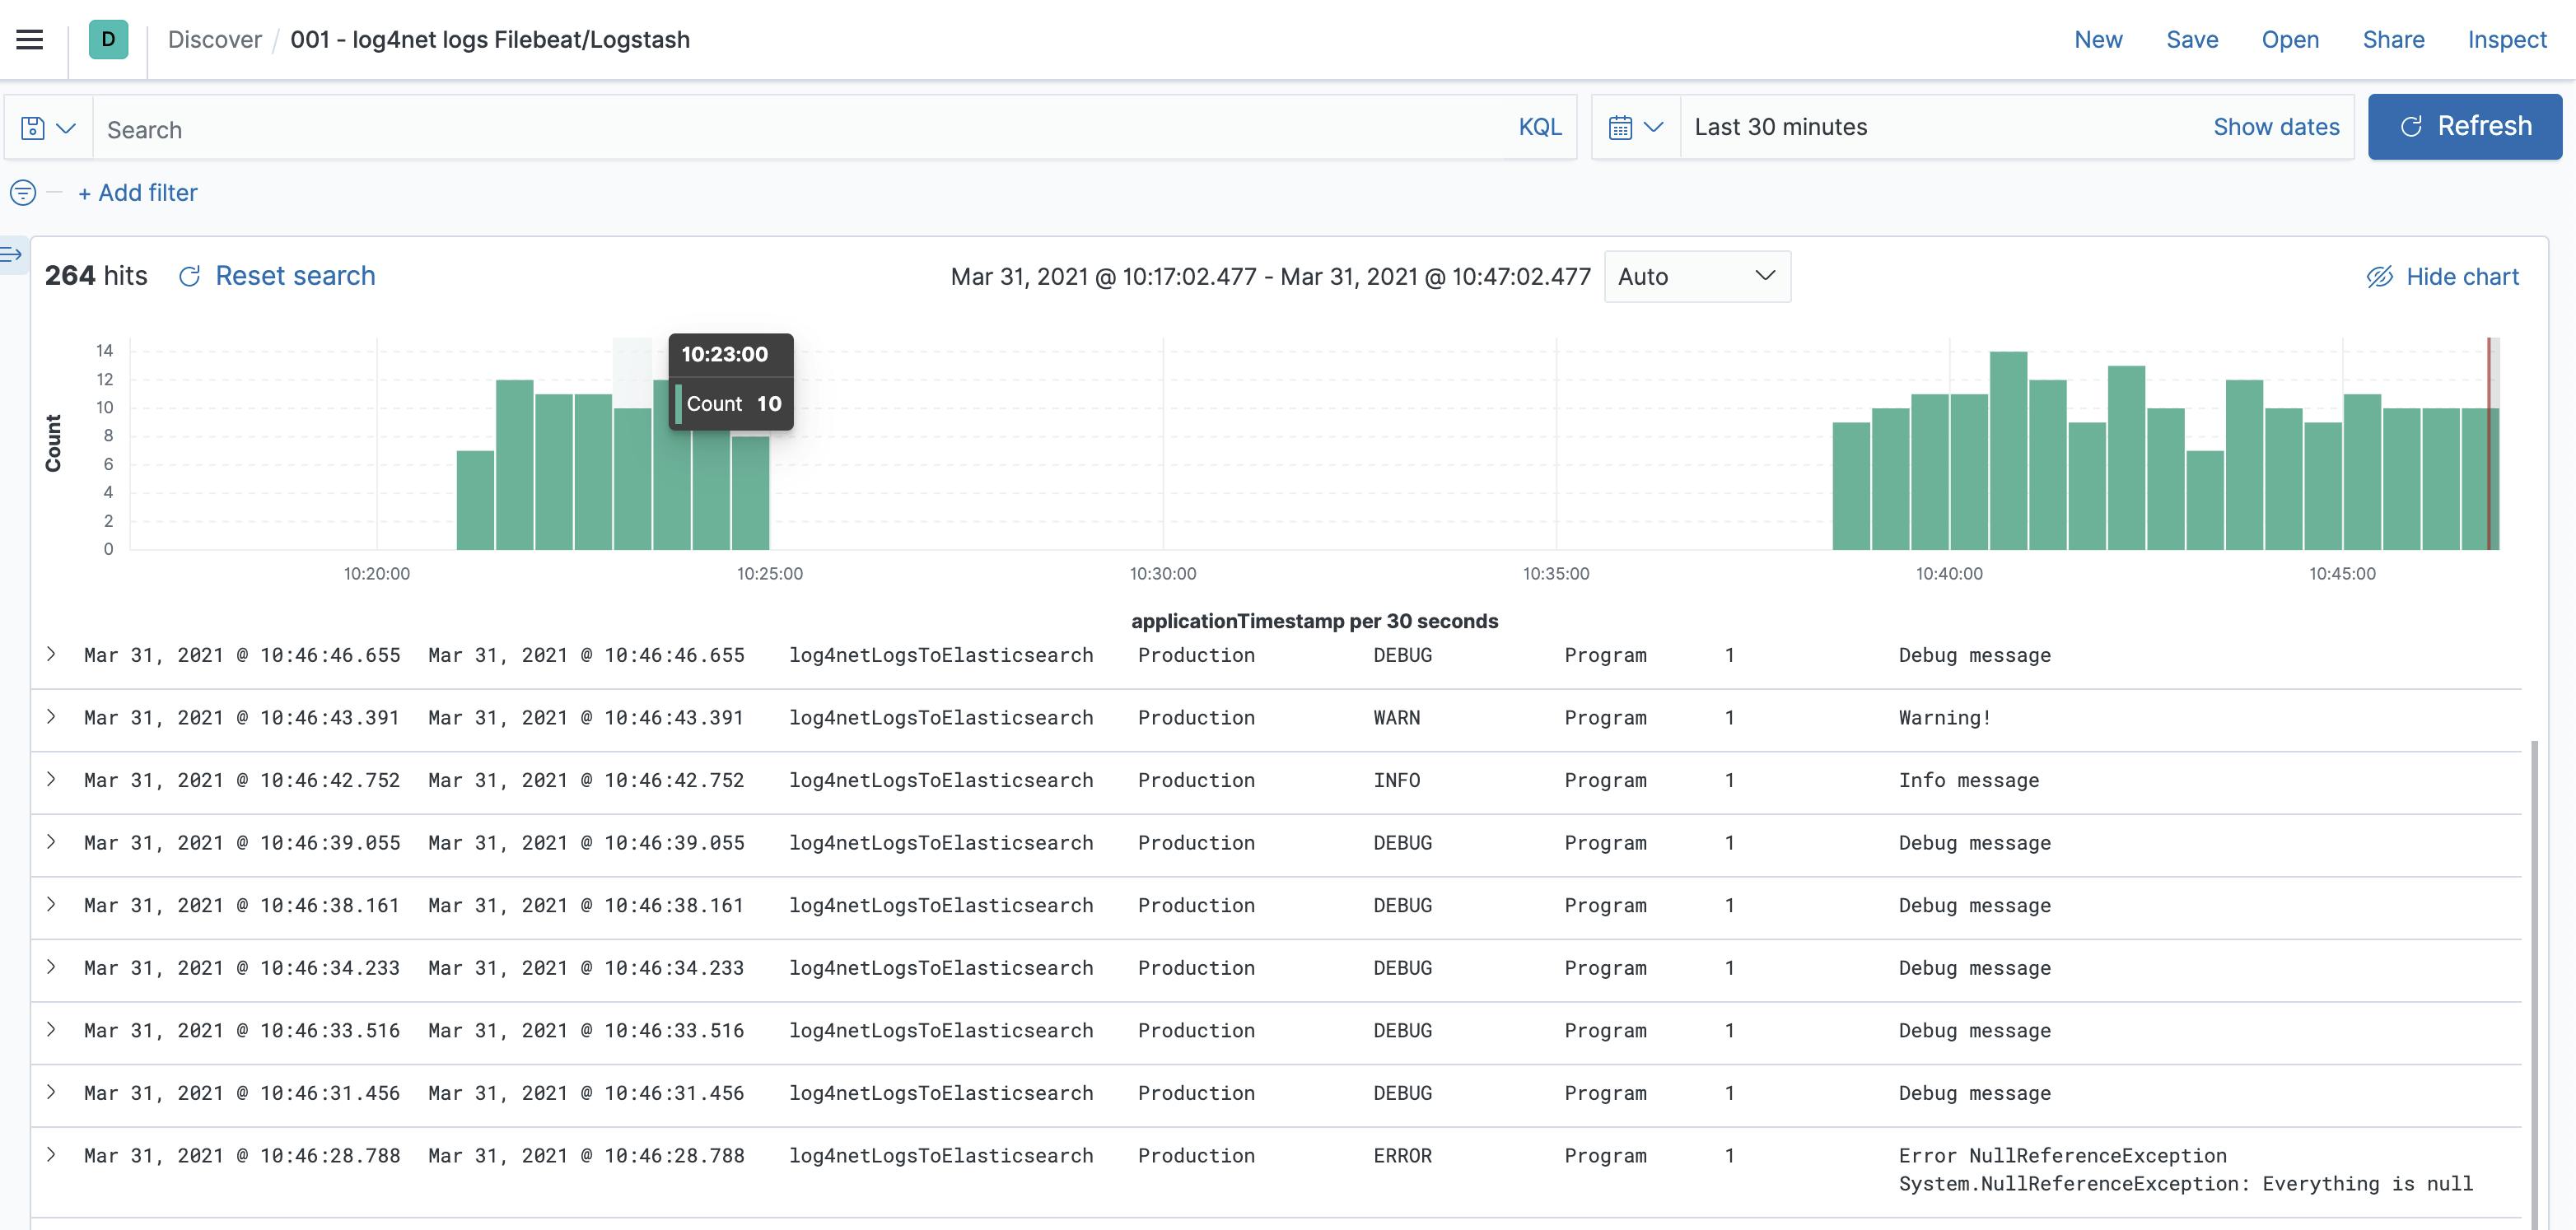
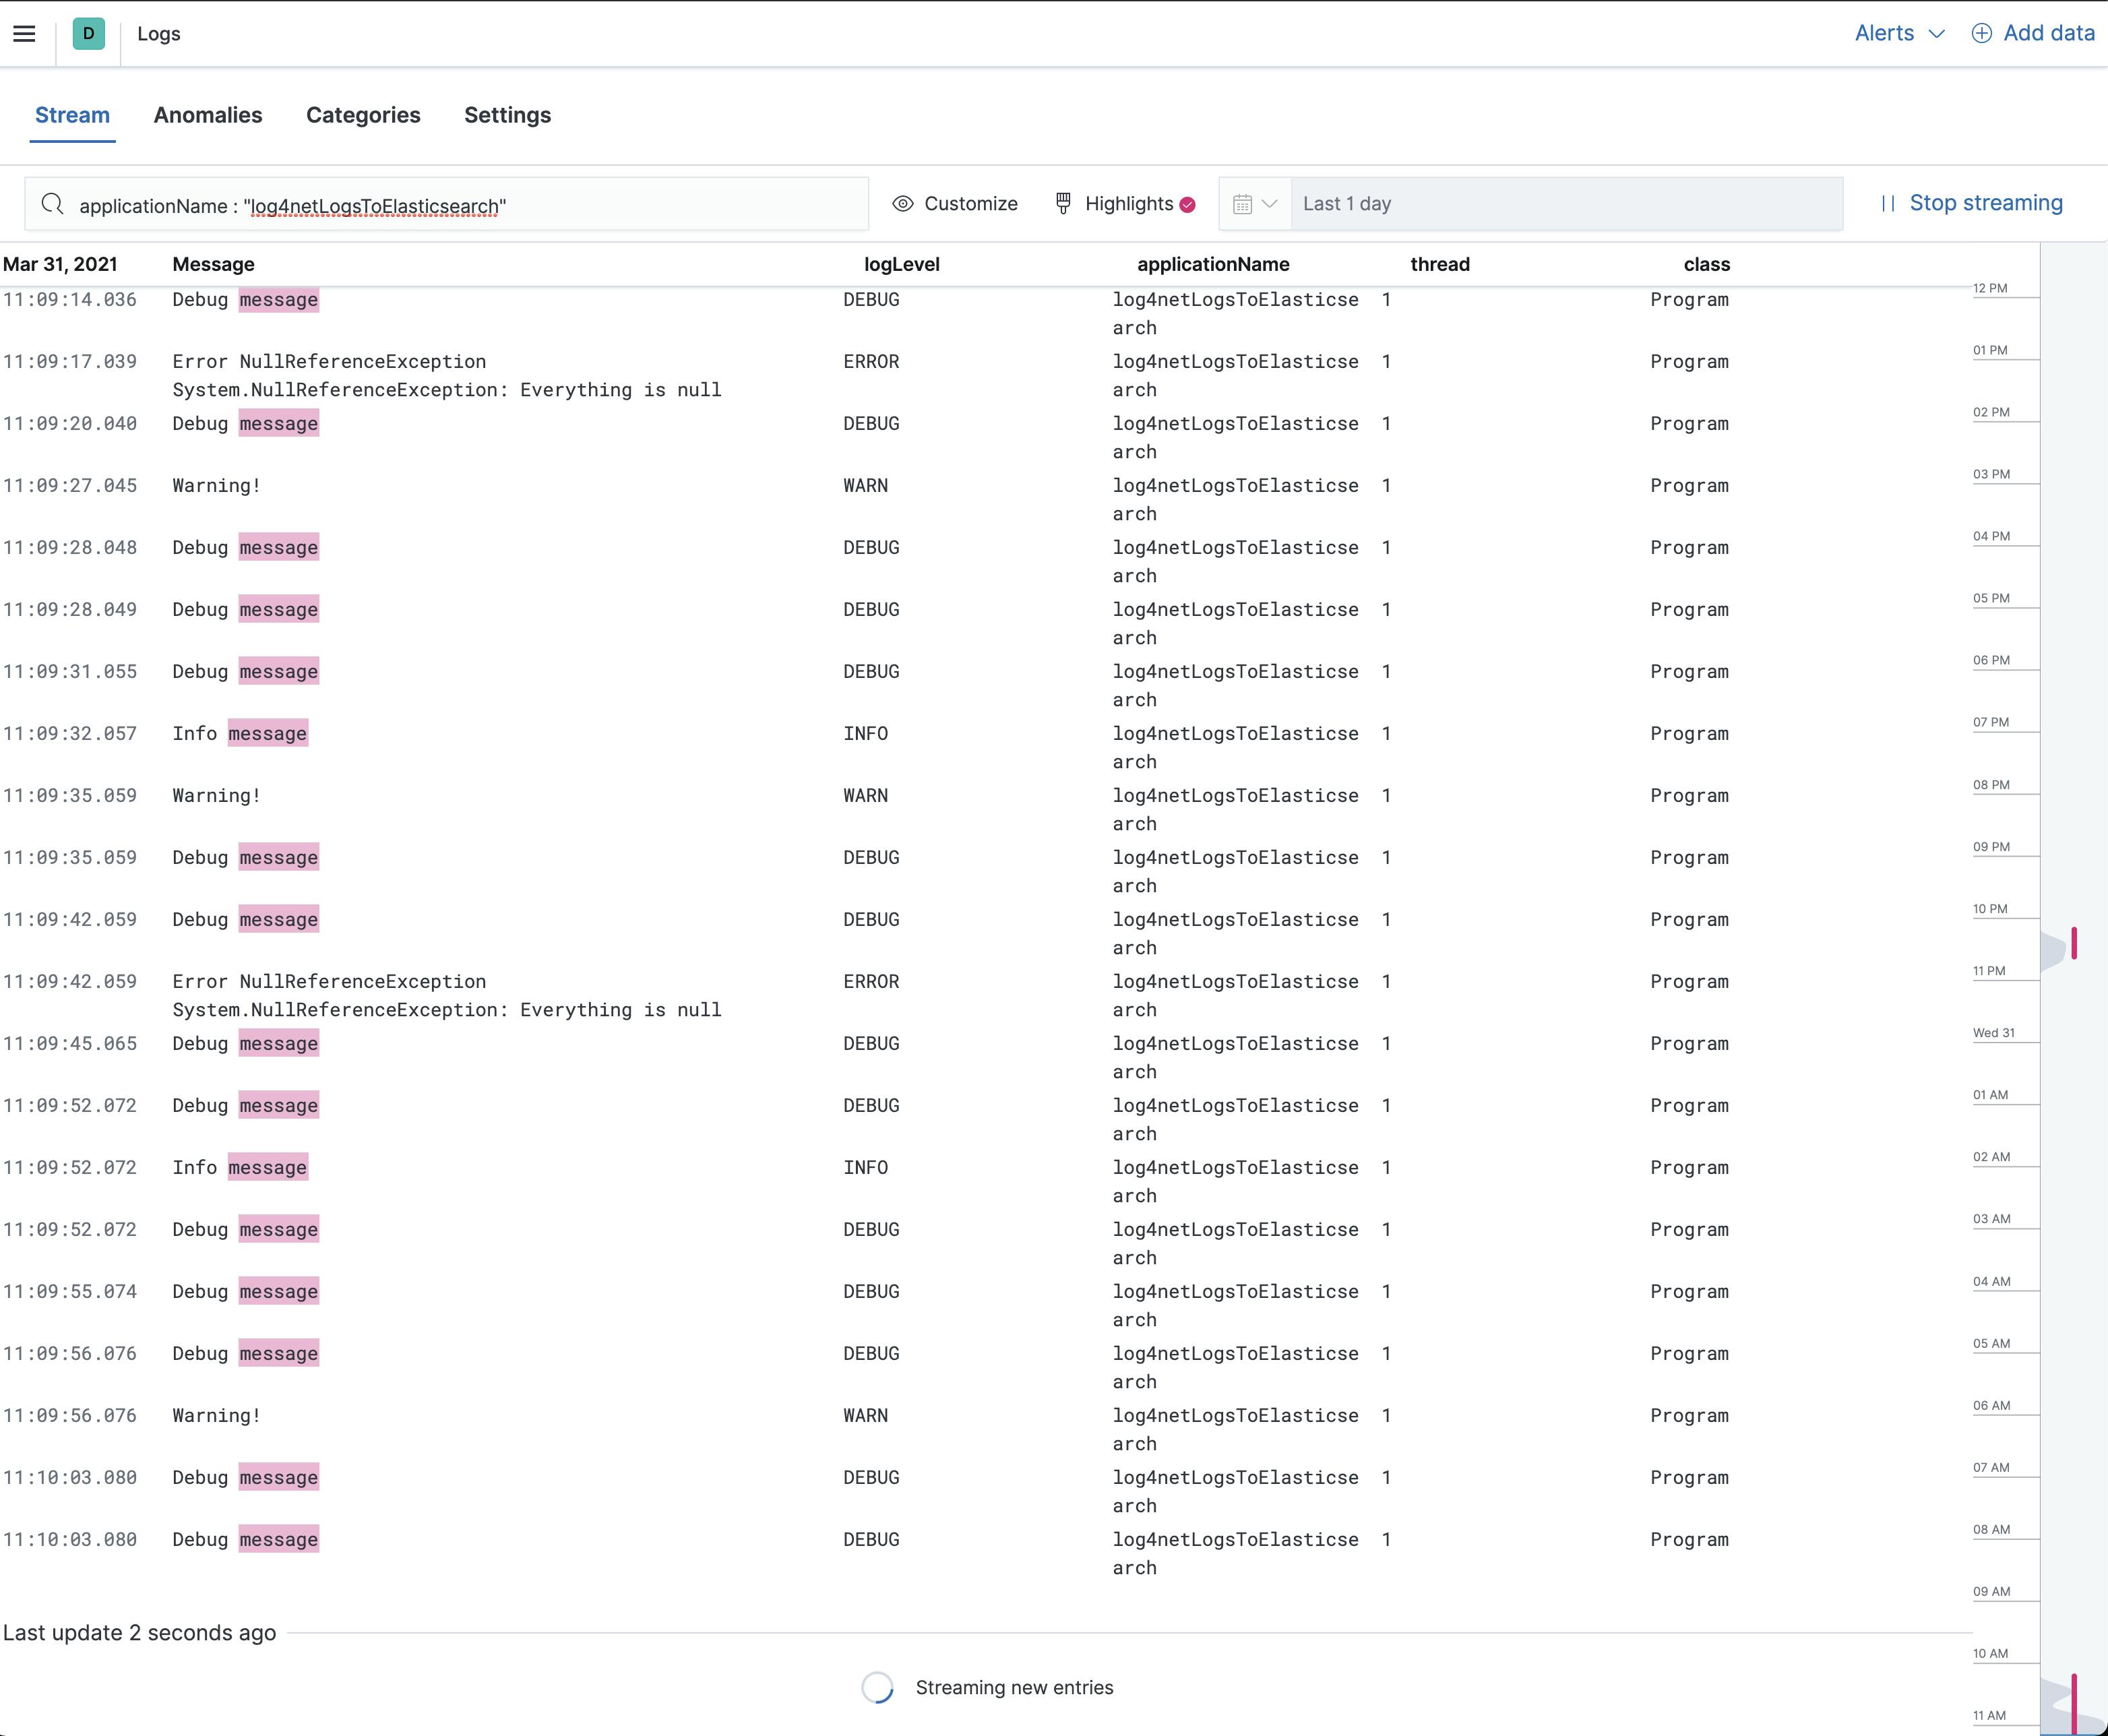
Now you can go to Observability → Logs. Here you can see all the logs and you can fast filter and highlight. In the settings, you can add the indices and the columns. This log view is very similar to the Discover view. But sometimes is it a little bit faster to see the live logs.
Conclusion
In this article, I tried to show you how to send logs to Elasticsearch using Filebeat via an Ingest Pipeline. If you have any questions or suggestions, feel free to post them in the comments.